. 2019 Sep 18;4(6):684-697.
doi: 10.1016/j.jacbts.2019.05.013. eCollection 2019 Oct.

JAK2 V617F -Mediated Clonal Hematopoiesis Accelerates Pathological Remodeling in Murine Heart Failure

Affiliations

JAK2 V617F -Mediated Clonal Hematopoiesis Accelerates Pathological Remodeling in Murine Heart Failure

Soichi Sano et al. JACC Basic Transl Sci. .

Abstract

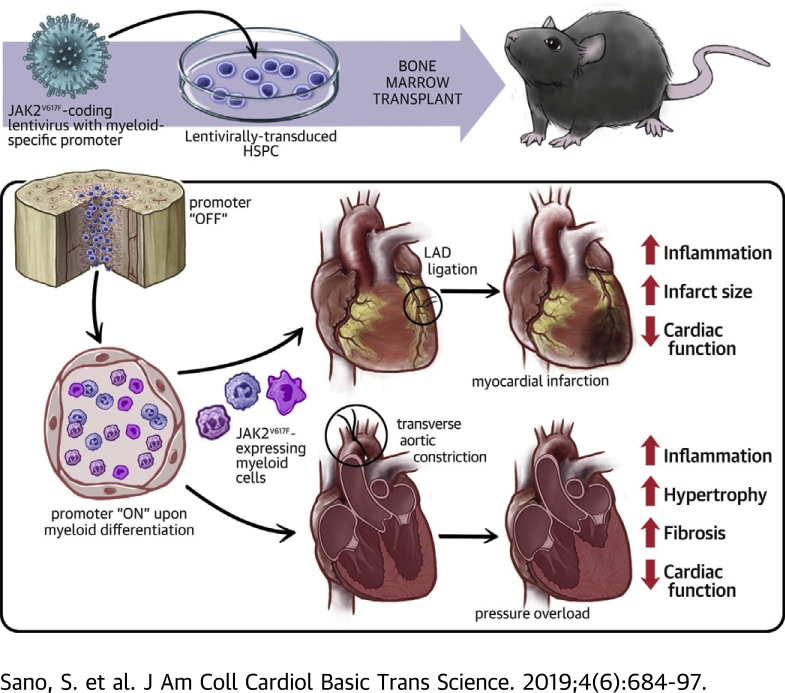
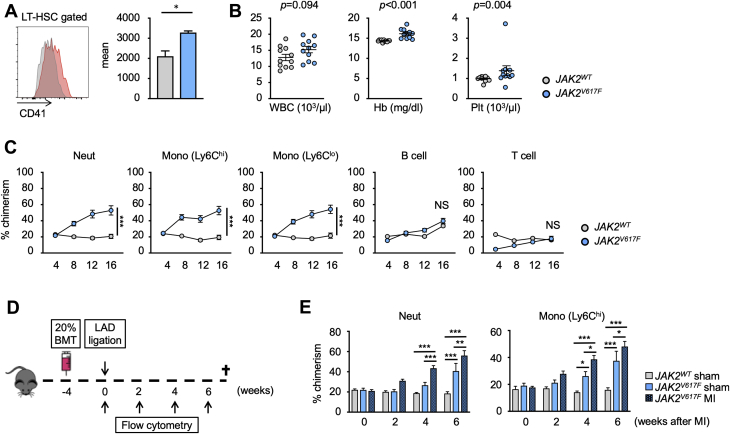
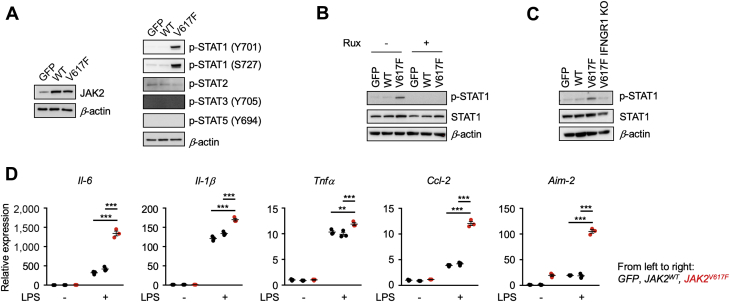
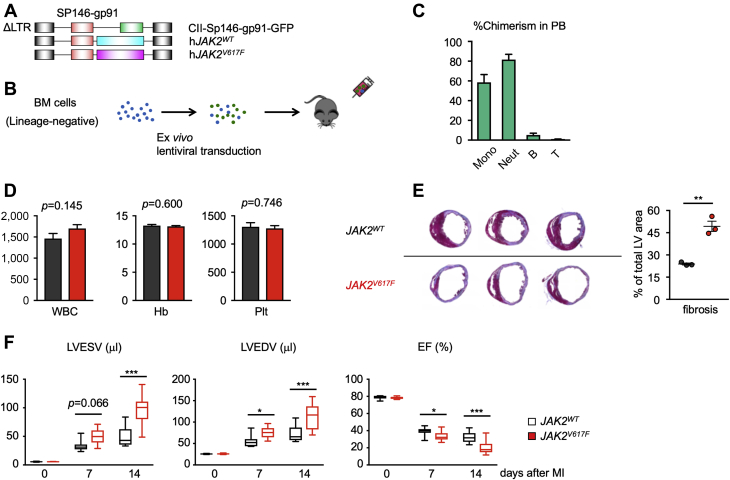
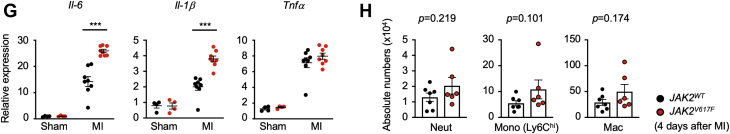
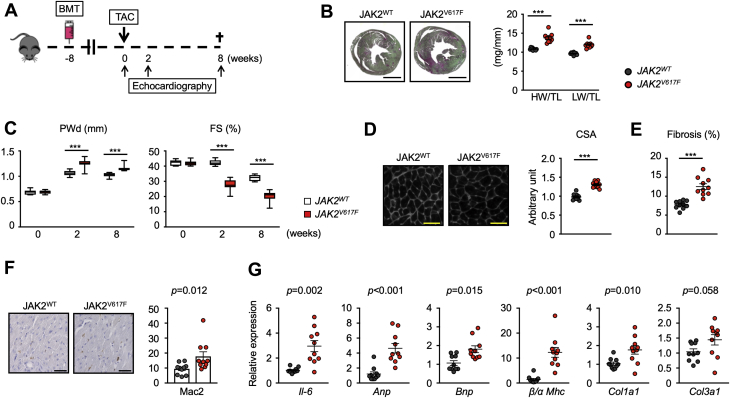
Janus kinase 2 (valine to phenylalanine at residue 617) (JAK2 V617F ) mutations lead to myeloproliferative neoplasms associated with elevated myeloid, erythroid, and megakaryocytic cells. Alternatively these same mutations can lead to the condition of clonal hematopoiesis with no impact on blood cell counts. Here, a model of myeloid-restricted JAK2 V617F expression from lineage-negative bone marrow cells was developed and evaluated. This model displayed greater cardiac inflammation and dysfunction following permanent left anterior descending artery ligation and transverse aortic constriction. These data suggest that JAK2 V617F mutations arising in myeloid progenitor cells may contribute to cardiovascular disease by promoting the proinflammatory properties of circulating myeloid cells.

Keywords: AIM2, absence in melanoma 2; ANOVA, analysis of variance; ARCH, age-related clonal hematopoiesis; BMT, bone marrow transplant; CCL2, C-C motif chemokine ligand 2; CHIP, clonal hematopoiesis of indeterminate potential; GFP, green fluorescent protein; HSC, hematopoietic stem cell; HSPC, hematopoietic stem and progenitor cell; IFNGR1, interferon gamma receptor 1; IL, interleukin; JAK2, Janus kinase 2; JAK2V617F, mutant Janus kinase 2 (valine to phenylalanine at residue 617); JAK2WT, wild-type Janus kinase 2; LPS, lipopolysaccharide; LT-HSC, long-term hematopoietic stem cell; MI, myocardial infarction; MPN, myeloproliferative neoplasm; NET, neutrophil extracellular traps; STAT, signal transducer and activator of transcription; TAC, transverse aortic constriction surgery; clonal hematopoiesis; left ventricular hypertrophy; myocardial infarction.


Figures

None
Graphical abstract
Figure 1
Figure 1
HSPCs Expressing JAK2V617F Display a Competitive Advantage in a Competitive BMT Assay That Is Highly Restricted to the Myeloid Lineage (A) Representative flow cytometry data to show that mutant Janus kinase 2 (valine to phenylalanine at residue 617) (JAK2V617F)–harboring long-term hematopoietic stem cell (LT-HSCs) display higher expression of CD41 protein compared with wild-type cells. LT-HSC population was defined as lineage, c-kit+, Sca-1+, CD48, and CD150+ cells. n = 3 in each group. Data are presented as mean fluorescence intensity. Statistical analysis was performed using 2-tailed unpaired Student’s t-test. (B) Absolute numbers of white blood cells, hemoglobin, and platelets of mice that underwent competitive transplantation with 20% JAK2V617F bone marrow or 20% wild-type bone marrow at 16 weeks after bone marrow transplantation (BMT). Data are shown as mean ± SEM. Statistical analysis was performed using 2-tailed unpaired Student’s t test (white blood cells [WBCs]), unequal variance t test (hemoglobin [Hb]), and Kruskal-Wallis test (platelets [Plt]). n = 11 in each group. (C) Flow cytometry analysis of peripheral blood showing that JAK2V617F cells displayed a competitive advantage over wild-type Janus kinase 2 (Jak2WT) competitor cells in a myeloid-biased manner. Peripheral blood was obtained at 4, 8, 12, and 16 weeks after BMT. n = 6 in Jak2WT groups and n = 16 in JAK2V617F groups. Statistical analysis was performed using 2-way repeated measures analysis of variance with Sidak’s multiple comparison tests. Significance stars are from Sidak’s tests. (D) Schematic that describes the experimental protocol. Left anterior descending artery (LAD) ligation surgery was performed 4 weeks after 20% competitive BMT. The chimerism of test cells in peripheral blood was evaluated by sequential flow cytometry analysis. (E) Flow cytometry analysis showing that experimental myocardial infarction (MI) induced by LAD ligation accelerates the expansion of JAK2V617F myeloid cells in peripheral blood. n = 6 to 8 in each group. Statistical analysis was performed using 2-way repeated measures analysis of variance with Tukey’s multiple comparison tests. Significance stars are from Tukey’s tests. *p < 0.05, **p < 0.01, ***p < 0.001. NS = not significant.
Figure 2
Figure 2
Myeloid Cells Transduced With the JAK2V617F Allele Exhibit Enhanced Proinflammatory Properties (A) Immunoblot analysis reveals modest overexpression of exogenous human JAK2WT and JAK2V617F in THP-1 cells using the lentivirus system (left). Green fluorescent protein (GFP) was expressed in control cells. Signal transducer and activator of transcription (STAT) activities in each experimental group of cells were evaluated by immunoblot with antibodies that detect the level of activating phosphorylation. (B) THP-1 cells were treated with 1 μM of ruxolitinib or vehicle. STAT1 phosphorylation was evaluated by immunoblot analysis. (C) THP-1 cells harboring JAK2V617F were transduced with a lentivirus encoding clustered regularly interspaced short palindromic repeats (CRISPR)/Cas9, red fluorescent protein, and single guide RNA targeting human interferon gamma receptor 1. STAT1 phosphorylation was evaluated by immunoblot analysis that detected decreased levels of phosphorylation in IFNGR1 knockout Jak2V617F THP-1 cells. (D) Gene expression analysis of THP-1 cells transduced with lentivirus encoding GFP, JAK2WT, or JAK2V617F at 8 h after stimulation with 10 ng/ml lipopolysaccharide (LPS). n = 3 in each group. Data are shown as mean ± SEM. Statistical analysis was performed using 2-way analysis of variance with Tukey’s multiple comparison tests. Significance stars are from Tukey’s tests. *p < 0.05, **p < 0.01, ***p < 0.001. AIM2 = AIM2, interferon-inducible protein A2; CCL2 = C-C motif chemokine ligand 2; IL = interleukin; p-STAT = phosphorylated; signal transducer and activator of transcription; Rux = ruxolitinib; TNF = tumor necrosis factor; other abbreviations as in Figure 1.
Figure 3
Figure 3
Mice With Myeloid-Specific JAK2V617F Mutation Have Inferior Outcome After MI (A) Construction of the lentivirus vectors used in this study. SP146-gp91 is a myeloid-specific enhancer and promoter, respectively. (B) Schematic of the study. Bone marrow–derived lineage-negative cells were transduced with lentivirus ex vivo and transplanted to lethally irradiated mice. Mice were subjected to LAD ligation surgery 8 weeks after BMT and were observed for an additional 8 weeks. (C) The proportion of GFP-positive cells in the peripheral blood from mice reconstituted with lineage-negative cells transduced with GFP-encoding lentivirus vector. Blood cell populations were analyzed by flow cytometry. n = 3 in each group. Data are shown as mean ± SEM. (D) Analysis of peripheral blood parameters of mice from each group (JAK2WT in black and JAK2V617F in red, n = 6). Data are shown as mean ± SEM. Statistical analysis was performed using 2-tailed unpaired Student’s t tests. (E) Representative cross-sectional images and analysis of Masson’s trichrome staining for cardiac fibrosis from each group of mice (n = 3) after LAD ligation surgery at the end of the study. Data are shown as mean ± SEM. Statistical analysis was performed using 2-tailed unpaired Student’s t-tests. (F) Sequential echocardiographic analysis of mice from each group (n = 11) before and after LAD ligation surgery at the indicated time points. Data are shown as minimum to maximum. Statistical analysis was performed using 2-way repeated measures analysis of variance with Sidak’s multiple comparison tests. Significance stars are from Sidak’s tests. (G) Analysis of transcript expression of proinflammatory cytokines in the infarct area were obtained from each group of mice 4 days after LAD ligation surgery. 36b4 was used as a reference for normalization. n = 8 in surgical groups and n = 4 in sham groups. Data are shown as mean ± SEM. Statistical analysis was performed by 2-way analysis of variance with Tukey’s multiple comparison tests. Significance stars are from Tukey’s tests. (H) Flow cytometry analysis of myeloid cell populations in the infarct area obtained from each group of mice 4 days after LAD ligation surgery. Cell numbers were normalized per 100-mg tissue weight. n = 6–7 in each group. Data are shown as mean ± SEM. Statistical analysis was performed using 2-tailed unpaired Student’s t test (neutrophil [Neut], macrophage) or Kruskal-Wallis test (Ly6ChiMono). *p < 0.05, **p < 0.01, ***p < 0.001. B = B cell; EF = ejection fraction; LTR = long-terminal repeat; LVEDV = left ventricular end-diastolic volume; LVESV = left ventricular end-systolic volume; Mono = monocyte; PB = peripheral blood; T = T cell; other abbreviations as in Figures 1 and 2.
Figure 3
Figure 3
Mice With Myeloid-Specific JAK2V617F Mutation Have Inferior Outcome After MI (A) Construction of the lentivirus vectors used in this study. SP146-gp91 is a myeloid-specific enhancer and promoter, respectively. (B) Schematic of the study. Bone marrow–derived lineage-negative cells were transduced with lentivirus ex vivo and transplanted to lethally irradiated mice. Mice were subjected to LAD ligation surgery 8 weeks after BMT and were observed for an additional 8 weeks. (C) The proportion of GFP-positive cells in the peripheral blood from mice reconstituted with lineage-negative cells transduced with GFP-encoding lentivirus vector. Blood cell populations were analyzed by flow cytometry. n = 3 in each group. Data are shown as mean ± SEM. (D) Analysis of peripheral blood parameters of mice from each group (JAK2WT in black and JAK2V617F in red, n = 6). Data are shown as mean ± SEM. Statistical analysis was performed using 2-tailed unpaired Student’s t tests. (E) Representative cross-sectional images and analysis of Masson’s trichrome staining for cardiac fibrosis from each group of mice (n = 3) after LAD ligation surgery at the end of the study. Data are shown as mean ± SEM. Statistical analysis was performed using 2-tailed unpaired Student’s t-tests. (F) Sequential echocardiographic analysis of mice from each group (n = 11) before and after LAD ligation surgery at the indicated time points. Data are shown as minimum to maximum. Statistical analysis was performed using 2-way repeated measures analysis of variance with Sidak’s multiple comparison tests. Significance stars are from Sidak’s tests. (G) Analysis of transcript expression of proinflammatory cytokines in the infarct area were obtained from each group of mice 4 days after LAD ligation surgery. 36b4 was used as a reference for normalization. n = 8 in surgical groups and n = 4 in sham groups. Data are shown as mean ± SEM. Statistical analysis was performed by 2-way analysis of variance with Tukey’s multiple comparison tests. Significance stars are from Tukey’s tests. (H) Flow cytometry analysis of myeloid cell populations in the infarct area obtained from each group of mice 4 days after LAD ligation surgery. Cell numbers were normalized per 100-mg tissue weight. n = 6–7 in each group. Data are shown as mean ± SEM. Statistical analysis was performed using 2-tailed unpaired Student’s t test (neutrophil [Neut], macrophage) or Kruskal-Wallis test (Ly6ChiMono). *p < 0.05, **p < 0.01, ***p < 0.001. B = B cell; EF = ejection fraction; LTR = long-terminal repeat; LVEDV = left ventricular end-diastolic volume; LVESV = left ventricular end-systolic volume; Mono = monocyte; PB = peripheral blood; T = T cell; other abbreviations as in Figures 1 and 2.
Figure 4
Figure 4
Mice With Myeloid-Specific JAK2V617F Mutation Display Greater Dysfunction in a Model of Pressure-Overload Hypertrophy (A) Schematic of the study. Lethally irradiated wild-type mice were transplanted with lineage-negative cells that were transduced by myeloid-specific lentivirus expression vectors. These mice were subjected to transverse aortic constriction surgery (TAC) 8 weeks after BMT. Echocardiography was performed at the times indicated and mice were euthanized 8 weeks after TAC. (B) Representative images of Picrosirius red/Fast Green staining of the heart (left), and heart weight and lung weight adjusted by tibia length (right) from each group (n = 10) at the end of the study. Scale bar = 3 mm. Data are shown as mean ± SEM. Statistical analysis was evaluated by unequal variance t test. (C) Sequential echocardiographic analysis of mice from each group (n = 10) before and after TAC at the indicated time points. Data are shown as minimum to maximum. Statistical analysis was evaluated by 2-way repeated measures analysis of variance with Sidak’s multiple comparison tests. Significance stars are from Sidak’s tests. (D) Representative images and analysis of wheat germ agglutinin staining of the heart sections from each group (n = 10) at the end of study. Scale bar = 100 μm. Data are shown as mean number per field. ± SEM. Statistical analysis was evaluated by 2-tailed unpaired Student’s t-test. (E) Analysis of Picrosirius red/Fast Green staining of the heart sections from each group (n = 10) presented in B, at the end of study. Data are shown as mean ± SEM. Statistical analysis was evaluated by unequal variance t test. (F) Representative images and analysis of Mac2 staining of the sections of hearts from mice of each group (n = 10) at the end of study. Scale bar = 100 um. Data are shown as mean ± SEM, Mac2+ cells per field. Statistical analysis was evaluated by Kruskal-Wallis test. (G) Analysis of transcript expression in the myocardium obtained from each group of mice (n = 10) 8 weeks after TAC surgery. 36b4 was used as a reference for normalization. Data are shown as mean ± SEM. Statistical analysis was evaluated by 2-tailed unpaired Student’s t test (Col3a1), unequal variance t test (IL-6, Col1a1) or by Kruskal-Wallis test (Anp, Bnp, β/α MHC). *p < 0.05, **p < 0.01, ***p < 0.001. CSA = cross-sectional area of myocyte; FS = fractional shortening; HW = heart weight; LW = lung weight; PWd = posterior wall thickness at diastole; TL = tibia length; other abbreviations as in Figure 1.

Comment in

References

    1. Fuster J.J., Walsh K. Somatic mutations and clonal hematopoiesis: unexpected potential new drivers of age-related cardiovascular disease. Circ Res. 2018;122:523–532. - PMC - PubMed
    1. Sano S., Wang Y., Walsh K. Clonal hematopoiesis and its impact on cardiovascular disease. Circ J. 2018;83:2–11. - PMC - PubMed
    1. Jan M., Ebert B.L., Jaiswal S. Clonal hematopoiesis. Semin Hematol. 2017;54:43–50. - PMC - PubMed
    1. Busque L., Mio R., Mattioli J. Nonrandom X-inactivation patterns in normal females: lyonization ratios vary with age. Blood. 1996;88:59–65. - PubMed
    1. Busque L., Patel J.P., Figueroa M.E. Recurrent somatic TET2 mutations in normal elderly individuals with clonal hematopoiesis. Nat Genet. 2012;44:1179–1181. - PMC - PubMed