. 2020 Mar;30(2):e02036.
doi: 10.1002/eap.2036. Epub 2019 Dec 11.

From metabarcoding to metaphylogeography: separating the wheat from the chaff

Affiliations

From metabarcoding to metaphylogeography: separating the wheat from the chaff

Xavier Turon et al. Ecol Appl. 2020 Mar.

Abstract

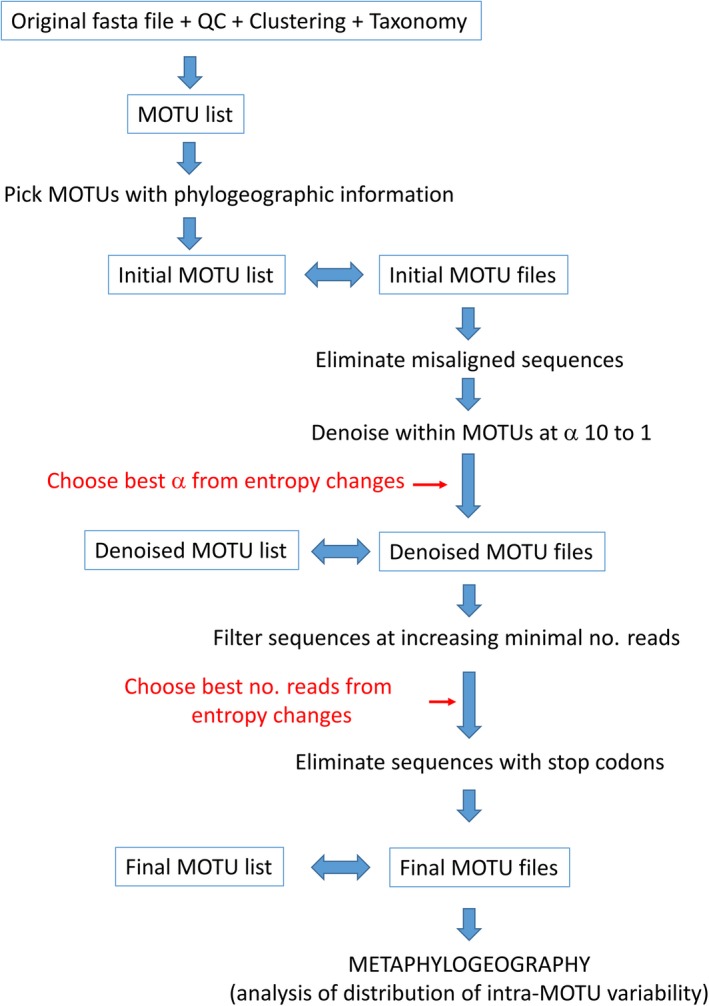
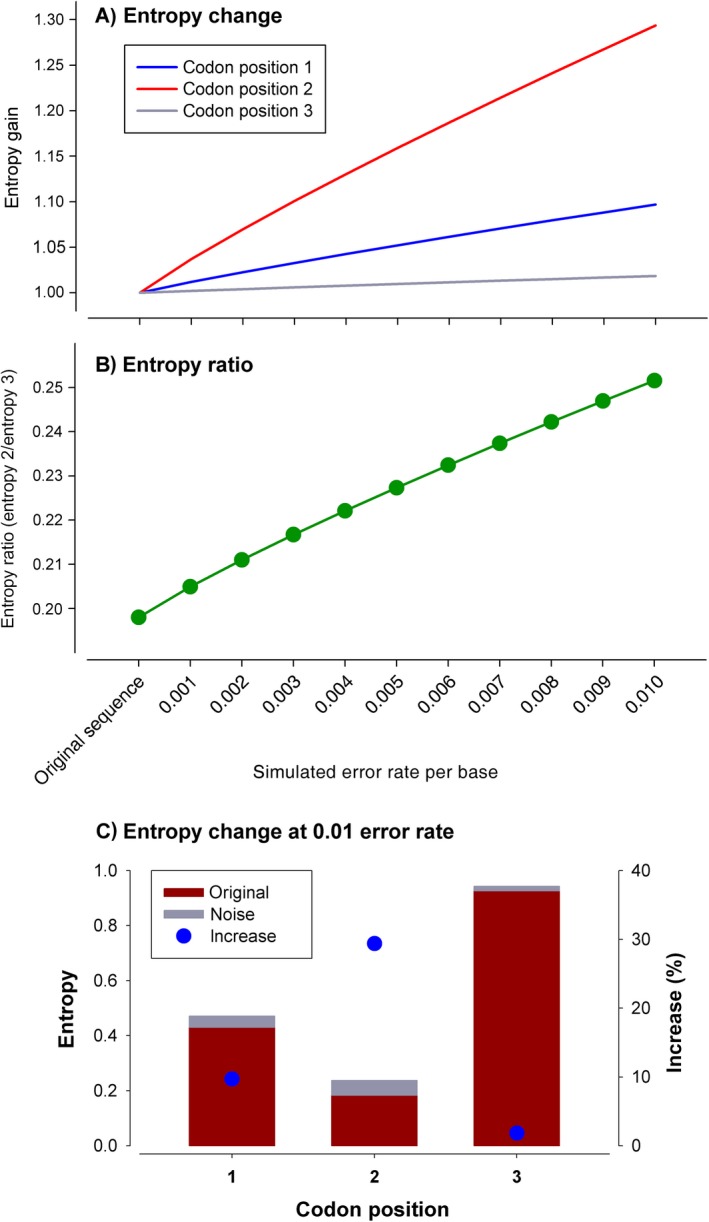
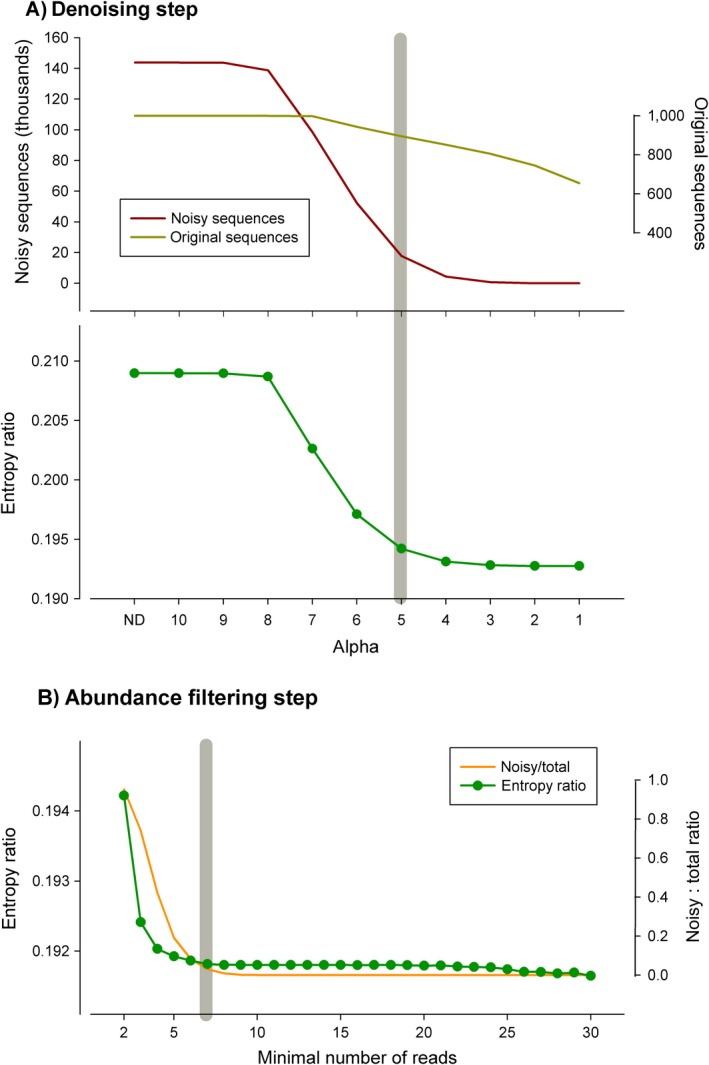
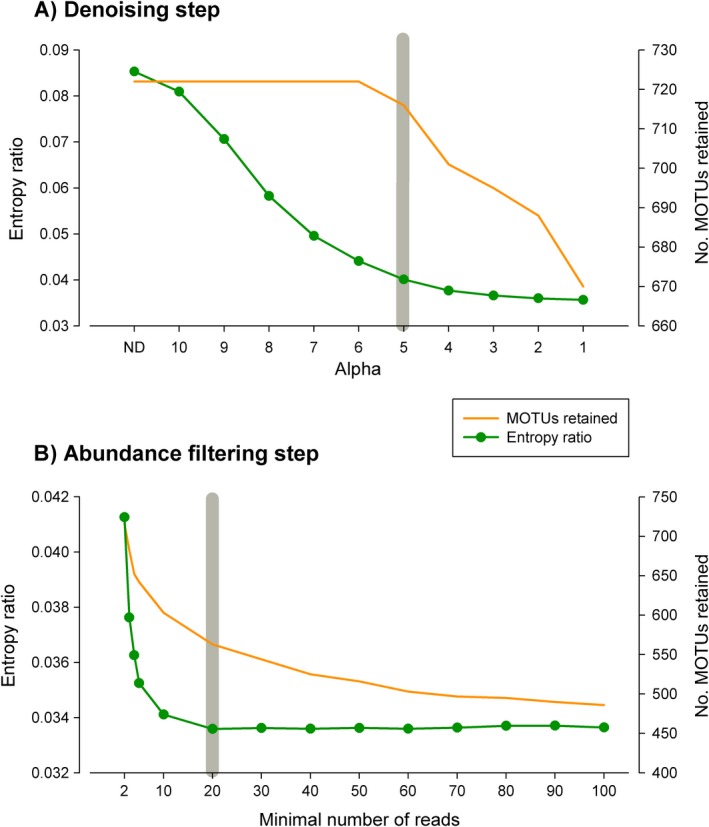
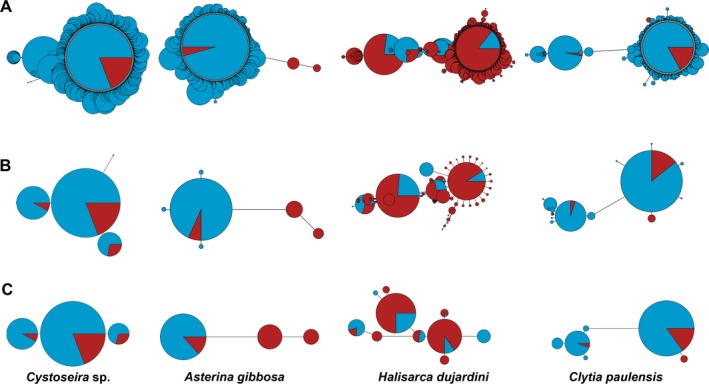
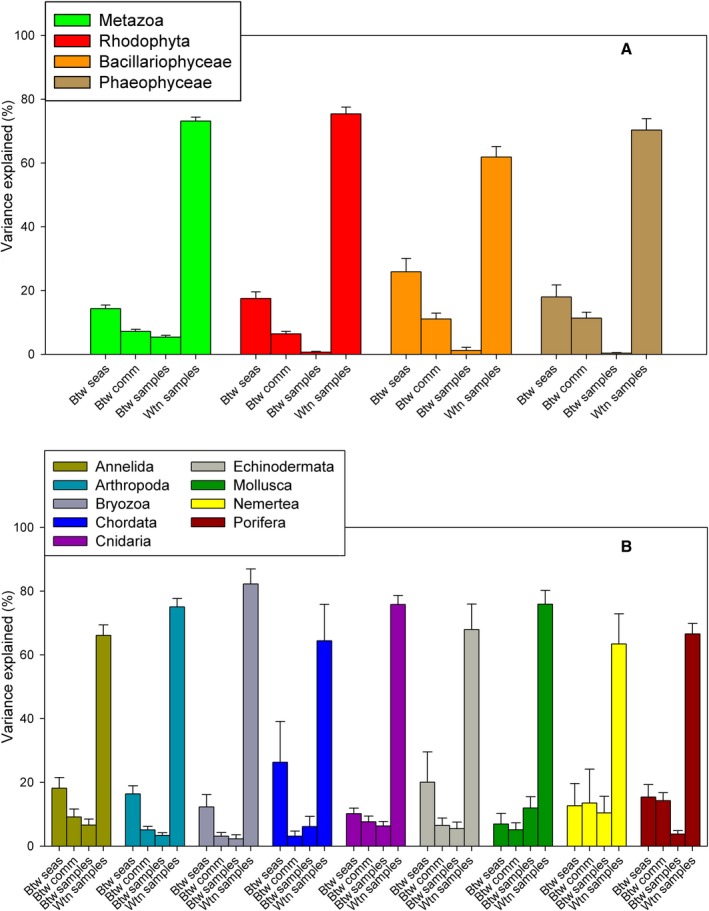
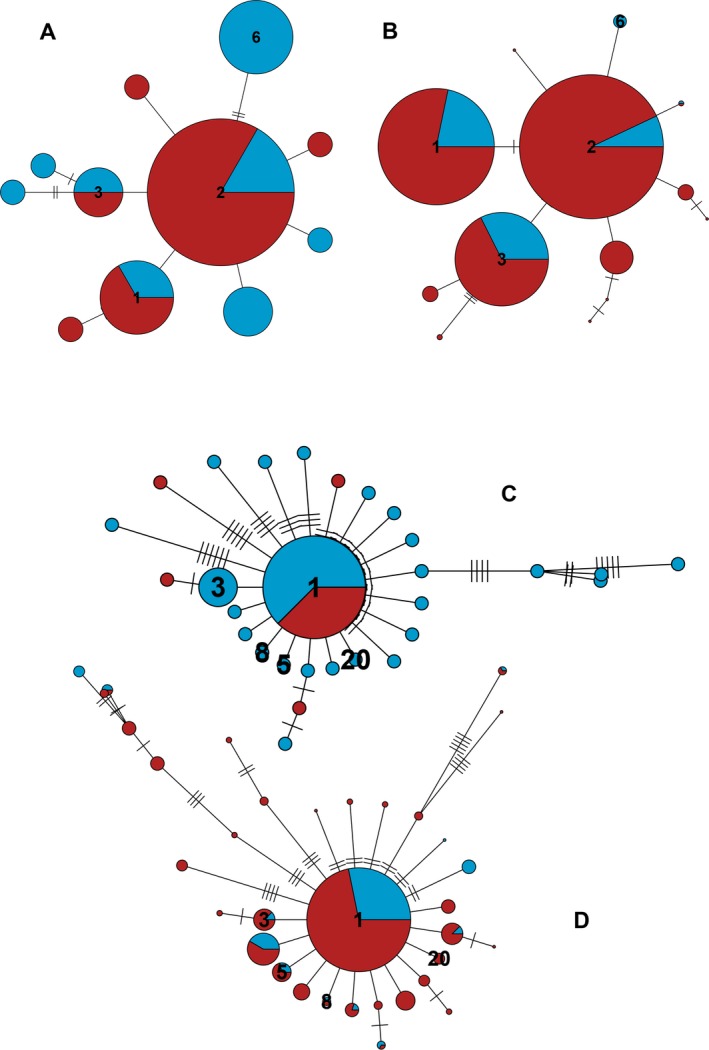
Metabarcoding is by now a well-established method for biodiversity assessment in terrestrial, freshwater, and marine environments. Metabarcoding data sets are usually used for α- and β-diversity estimates, that is, interspecies (or inter-MOTU [molecular operational taxonomic unit]) patterns. However, the use of hypervariable metabarcoding markers may provide an enormous amount of intraspecies (intra-MOTU) information-mostly untapped so far. The use of cytochrome oxidase (COI) amplicons is gaining momentum in metabarcoding studies targeting eukaryote richness. COI has been for a long time the marker of choice in population genetics and phylogeographic studies. Therefore, COI metabarcoding data sets may be used to study intraspecies patterns and phylogeographic features for hundreds of species simultaneously, opening a new field that we suggest to name metaphylogeography. The main challenge for the implementation of this approach is the separation of erroneous sequences from true intra-MOTU variation. Here, we develop a cleaning protocol based on changes in entropy of the different codon positions of the COI sequence, together with co-occurrence patterns of sequences. Using a data set of community DNA from several benthic littoral communities in the Mediterranean and Atlantic seas, we first tested by simulation on a subset of sequences a two-step cleaning approach consisting of a denoising step followed by a minimal abundance filtering. The procedure was then applied to the whole data set. We obtained a total of 563 MOTUs that were usable for phylogeographic inference. We used semiquantitative rank data instead of read abundances to perform AMOVAs and haplotype networks. Genetic variability was mainly concentrated within samples, but with an important between seas component as well. There were intergroup differences in the amount of variability between and within communities in each sea. For two species, the results could be compared with traditional Sanger sequence data available for the same zones, giving similar patterns. Our study shows that metabarcoding data can be used to infer intra- and interpopulation genetic variability of many species at a time, providing a new method with great potential for basic biogeography, connectivity and dispersal studies, and for the more applied fields of conservation genetics, invasion genetics, and design of protected areas.

Keywords: AMOVA; Illumina; connectivity; cytochrome oxidase; eukaryotes; haplotype networks; metabarcoding; phylogeography; sequencing errors.


Figures

Figure 1
Figure 1
Schematic representation of the pipeline followed in this study. See Methods for details. The red arrows and text indicate the two steps in the pipeline where parameter selection should be carried out based on entropy values. MOTU, molecular operational taxonomic unit.
Figure 2
Figure 2
Simulation analysis. (A) Relative increase (initial value = 1) of the entropy values of each position at increased error rates. Bar plot shows the original and added entropy of each position at the highest (0.01) error rate. (B) Change in the entropy ratio. (C) Bar plot showing the original and added entropy of each position at the highest (0.01) error rate.
Figure 3
Figure 3
Simulation analysis. (A) Variation in the number of original and erroneous (“noisy”) sequences and entropy ratio at decreasing values of the alpha parameter of the denoising algorithm (ND, no denoising). (B) Change in the entropy ratio and in proportion of noisy vs. original sequences after filtering the data set by minimal abundance. The gray bars indicate the selected values of alpha (5) and minimal number of reads (7).
Figure 4
Figure 4
Final analyses of the littoral communities data set. (A) Variation in the number of sequences and number of MOTUs remaining at decreasing values of the alpha parameter (ND, no denoising) of the denoising algorithm. (B) Change in the entropy ratio and (C) change in residual (within‐sample) variance of the amova model. The gray bars indicate the selected alpha value (5) and abundance threshold (20).
Figure 5
Figure 5
Selected instances of networks obtained at different stages of the pipeline: (A) without filters; (B) after denoising at alpha = 5; (C) after denoising at alpha = 5 plus minimal abundance filtering (threshold 20 reads). Circles represent haplotypes, and their diameters are proportional to their abundance (in semiquantitative ranks) in the samples. Blue color represent abundance in Mediterranean samples, red color in Atlantic samples. Length of links is proportional to the number of mutational steps between haplotypes. Note that circles in panels A, B, and C are not drawn to the same scale. The names correspond to the taxonomical identification of the MOTUs with ecotag (OBITools package). The MOTU ids (as per Data S1) are, from left to right, 143, 1740, 2500, and 25366.
Figure 6
Figure 6
Summary of the mean percentage of variance explained by the hierarchical structure of the AMOVA: (A) as per eukaryote groups; (B) per metazoan phyla. Error bars are standard errors. Btw seas, between seas; btw comm, between communities within seas; btw samples, between samples within communities; wtn samples, within samples.
Figure 7
Figure 7
(A) Network constructed with the 11 haplotypes of the sea urchin Paracentrotus lividus found by Duran et al. (2004) in localities close to our sampling points and (B) network constructed with the 13 haplotypes comprising the MOTU corresponding to this species (id 697). Haplotypes common to both studies are numbered. (C) Network with the 29 haplotypes of the brittle star Ophiothrix fragilis identified by Pérez‐Portela et al. (2013) in localities close to our sampling points. (D) Network of the 34 haplotypes found in the present study in the MOTU corresponding to this species (id 15396). Haplotypes common to both studies are numbered. The short slashes in the links between haplotypes represent mutational steps. Colors as in Fig. 5.

References

    1. Adamowicz, S. J. , et al. 2019. Trends in DNA barcoding and metabarcoding. Genome 62:5–8. - PubMed
    1. Adams, C. I. M. , Knapp M., Gemmell N. J., Jeunen G. J., Bunce M., Lamare M., and Taylor H. R.. 2019. Beyond diversity: can environmental DNA (eDNA) cur it as a population genetic tool? Genes 10:192. - PMC - PubMed
    1. Andújar, C. , Arribas P., Yu D. W., Vogler A. P., and Emerson B. C.. 2018. Why the COI barcode should be the community DNA metabarcode for the Metazoa. Molecular Ecology 27:3968–3975. - PubMed
    1. Avise, J. C. 2009. Phylogeography: retrospect and prospect. Journal of Biogeography 36:3–15.
    1. Aylagas, E. , Borja A., Irigoien X., and Rodríguez‐Ezpeleta N.. 2016. Benchmarking DNA metabarcoding for biodiversity‐based monitoring and assessment. Frontiers in Marine Science 3:1–12.

Publication types