

Therapeutic targeting of circ-CUX1/EWSR1/MAZ axis inhibits glycolysis and neuroblastoma progression
- PMID: 31709724
- PMCID: PMC6895612
- DOI: 10.15252/emmm.201910835
Therapeutic targeting of circ-CUX1/EWSR1/MAZ axis inhibits glycolysis and neuroblastoma progression
Abstract
Aerobic glycolysis is a hallmark of metabolic reprogramming in tumor progression. However, the mechanisms regulating glycolytic gene expression remain elusive in neuroblastoma (NB), the most common extracranial malignancy in childhood. Herein, we identify that CUT-like homeobox 1 (CUX1) and CUX1-generated circular RNA (circ-CUX1) contribute to aerobic glycolysis and NB progression. Mechanistically, p110 CUX1, a transcription factor generated by proteolytic processing of p200 CUX1, promotes the expression of enolase 1, glucose-6-phosphate isomerase, and phosphoglycerate kinase 1, while circ-CUX1 binds to EWS RNA-binding protein 1 (EWSR1) to facilitate its interaction with MYC-associated zinc finger protein (MAZ), resulting in transactivation of MAZ and transcriptional alteration of CUX1 and other genes associated with tumor progression. Administration of an inhibitory peptide blocking circ-CUX1-EWSR1 interaction or lentivirus mediating circ-CUX1 knockdown suppresses aerobic glycolysis, growth, and aggressiveness of NB cells. In clinical NB cases, CUX1 is an independent prognostic factor for unfavorable outcome, and patients with high circ-CUX1 expression have lower survival probability. These results indicate circ-CUX1/EWSR1/MAZ axis as a therapeutic target for aerobic glycolysis and NB progression.
Keywords: CUT-like homeobox 1; EWS RNA-binding protein 1; MYC-associated zinc finger protein; circular RNA; tumor progression.
© 2019 The Authors. Published under the terms of the CC BY 4.0 license.
Conflict of interest statement
The authors declare that they have no conflict of interest.
Figures
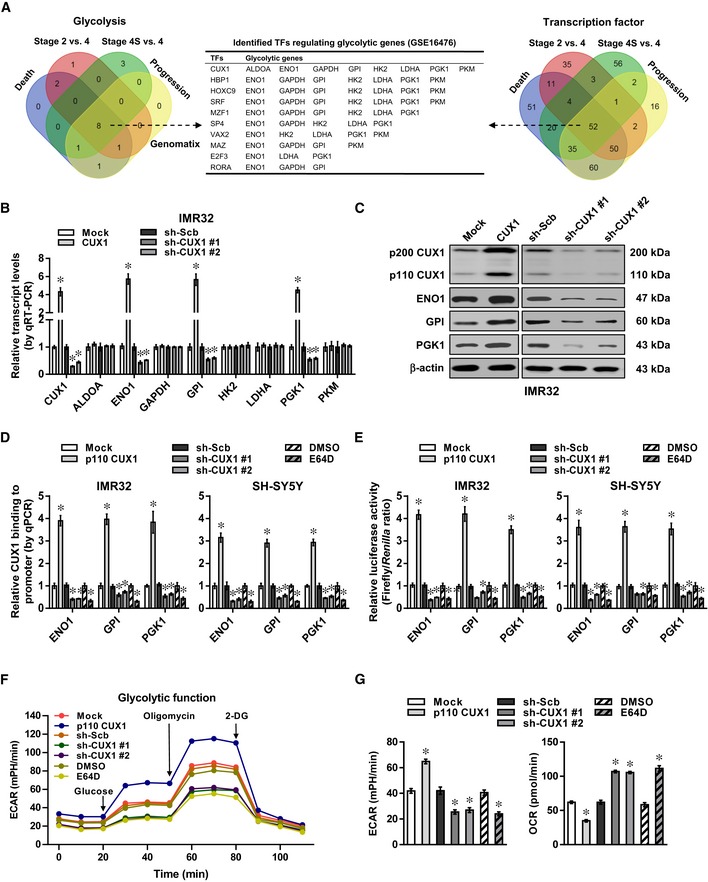
- A
Venn diagram indicating the identification of differentially expressed glycolytic genes and transcription factors (fold change > 2.0, Student's t‐test, P < 0.05) in 88 NB cases (GSE16476), and over‐lapping analysis with potential transcription factors regulating glycolytic genes revealed by Genomatix program.
- B, C
Real‐time qRT–PCR (B, normalized to β‐actin, n = 5) and Western blot (C) assays revealing the expression of CUX1 and glycolytic genes in IMR32 cells stably transfected with empty vector (mock), p200 CUX1, scramble shRNA (sh‐Scb), sh‐CUX1 #1, or sh‐CUX1 #2. Student's t‐test, one‐way ANOVA, *P < 0.05 versus mock or sh‐Scb.
- D, E
ChIP and qPCR using Flag and CUX1 antibodies (D) and dual‐luciferase (E) assays indicating the p110 CUX1 enrichment and promoter activity of ENO1, GPI, and PGK1 in IMR32 and SH‐SY5Y cells stably transfected with mock, Flag‐tagged p110 CUX1, sh‐Scb, sh‐CUX1 #1, or sh‐CUX1 #2, and those treated with E64D (10 μM) for 24 h (n = 5). Student's t‐test, one‐way ANOVA, *P < 0.05 versus mock, sh‐Scb, or DMSO.
- F, G
Seahorse tracing curves (F), ECAR and OCR (G) of IMR32 cells stably transfected with mock, p110 CUX1, sh‐Scb, sh‐CUX1 #1, or sh‐CUX1 #2, and those treated with E64D (10 μM) for 24 h (n = 5). Student's t‐test, one‐way ANOVA, *P < 0.05 versus mock, sh‐Scb, or DMSO.
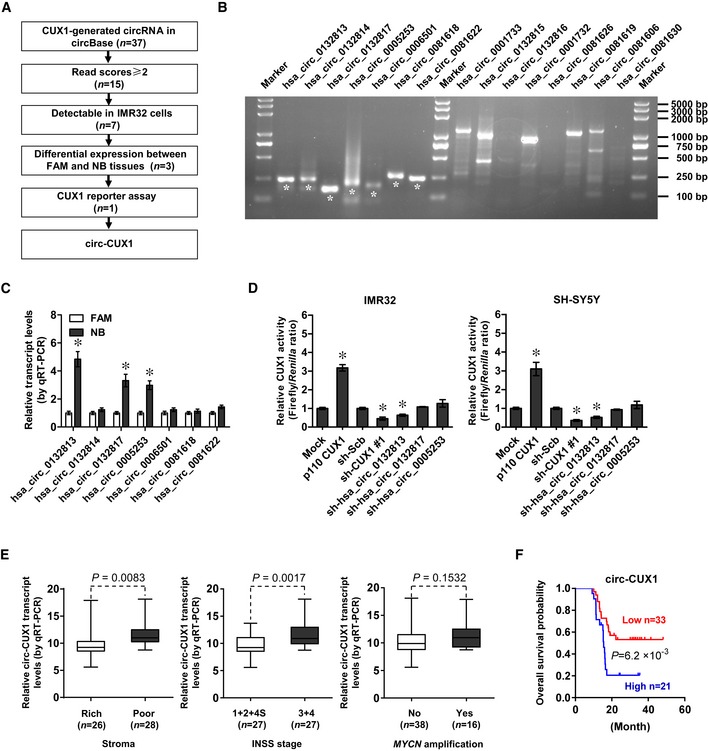
- A
Flowchart delineating the discovery of circ‐CUX1 from tumor tissues and cell lines. FAM, normal fetal adrenal medulla.
- B
RT–PCR assay with divergent primers showing the detectable circRNAs of correct size (asterisks) in IMR32 cells.
- C
Real‐time qRT–PCR assay indicating the circRNA levels in FAM (n = 13) and NB tissues (n = 20). Student's t‐test, *P < 0.05 versus FAM.
- D
Dual‐luciferase assay showing transactivation activity of CUX1 in IMR32 and SH‐SY5Y cells transfected as indicated (n = 5). Student's t‐test, one‐way ANOVA, *P < 0.05 versus empty vector (mock) or scramble shRNA (sh‐Scb).
- E
Real‐time qRT–PCR assay indicating circ‐CUX1 levels (normalized to β‐actin) in NB tissues (n = 54). Bars are means and whiskers show min to max. Student's t‐test.
- F
Kaplan–Meier curve showing overall survival of 54 NB patients with low or high circ‐CUX1 levels (cutoff value = 10.77). Log‐rank test.
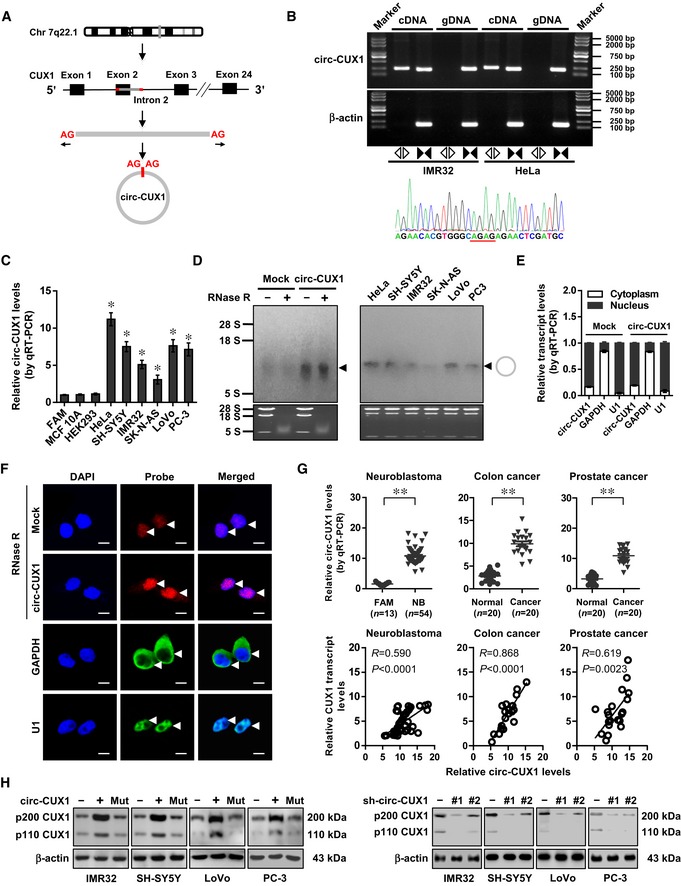
- A
Schematic illustration showing the generation of circ‐CUX1 from CUX1.
- B
RT–PCR or PCR assay revealing the amplification of circ‐CUX1 from cDNA or genomic DNA (gDNA) of IMR32 and HeLa cells, with validation by Sanger sequencing.
- C, D
Real‐time qRT–PCR (C, normalized to β‐actin, n = 6) and Northern blot (D) indicating the circ‐CUX1 levels in cell lines and IMR32 cells transfected with empty vector (mock) or circ‐CUX1 and treated with RNase R (3 U μg−1). One‐way ANOVA, *P < 0.05 versus HEK293.
- E, F
Real‐time qRT–PCR (E, normalized to β‐actin) and RNA‐FISH with antisense junction probe and RNase R (3 U μg−1) treatment (F) showing the distribution and localization (arrowheads) of circ‐CUX1 in IMR32 cells stably transfected with mock or circ‐CUX1 (n = 5), using GAPDH and U1 as controls. Scale bar: 10 μm.
- G
Real‐time qRT–PCR assay indicating circ‐CUX1 expression (normalized to β‐actin) and its correlation with CUX1 levels (Pearson's correlation coefficient) in tumor tissues, normal fetal adrenal medulla (FAM), or normal counterparts. Student's t‐test, **P < 0.01 versus FAM or normal.
- H
Western blot showing the CUX1 levels in tumor cells stably transfected as indicated.
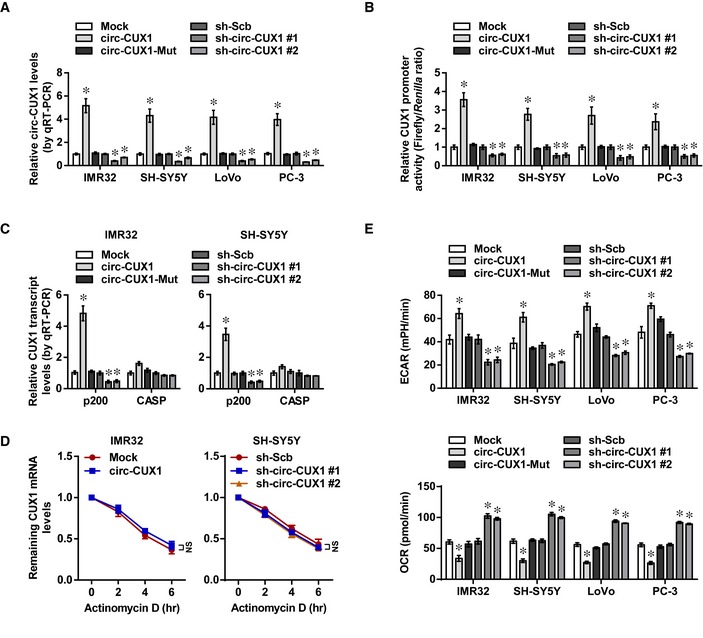
- A
Real‐time qRT–PCR assay indicating expression of circ‐CUX1 (normalized to β‐actin) in IMR32, SH‐SY5Y, LoVo, or PC‐3 cells stably transfected as indicated (n = 5). One‐way ANOVA, *P < 0.05 versus empty vector (mock) or scramble shRNA (sh‐Scb).
- B
Dual‐luciferase assay showing the activity of CUX1 promoter in IMR32, SH‐SY5Y, LoVo, or PC‐3 cells stably transfected as indicated (n = 5). One‐way ANOVA, *P < 0.05 versus mock or sh‐Scb.
- C
Real‐time qRT–PCR assay indicating expression of CUX1 isoforms (normalized to β‐actin) in IMR32 and SH‐SY5Y cells stably transfected as indicated (n = 5). One‐way ANOVA, *P < 0.05 versus empty vector (mock) or scramble shRNA (sh‐Scb).
- D
Real‐time qRT–PCR assay indicating CUX1 mRNA levels in IMR32 and SH‐SY5Y cells stably transfected as indicated (n = 5), and those treated with actinomycin D (5 μg ml−1). One‐way ANOVA, NS: non‐significant.
- E
Seahorse extracellular flux assay showing ECAR and OCR in IMR32, SH‐SY5Y, LoVo, or PC‐3 cells stably transfected as indicated (n = 6). One‐way ANOVA, *P < 0.05 versus mock or sh‐Scb.
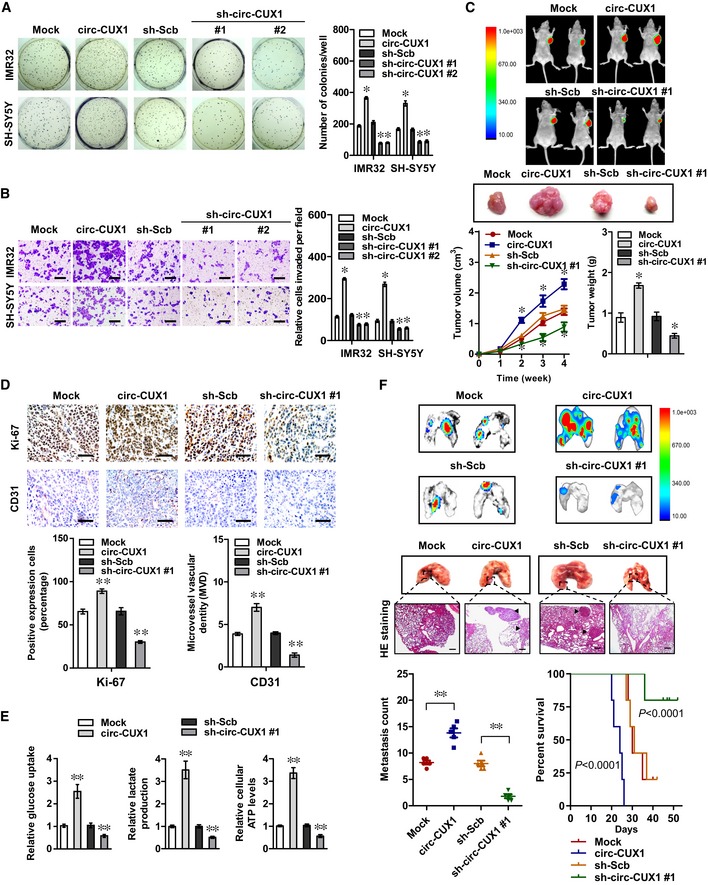
- A, B
Soft agar (A) and Matrigel invasion (B) assays showing the anchorage‐independent growth and invasion capability of IMR32 and SH‐SY5Y cells stably transfected with empty vector (mock), circ‐CUX1, scramble shRNA (sh‐Scb), or sh‐circ‐CUX1 (n = 5). Scale bars: 100 μm. Student's t‐test, one‐way ANOVA, *P < 0.05 versus mock or sh‐Scb.
- C
Representative fluorescence images, in vivo growth curve, and weight at the end points of subcutaneous xenograft tumors formed by IMR32 cells stably transfected as indicated in nude mice (n = 5 for each group). Student's t‐test, one‐way ANOVA, *P < 0.05 versus mock or sh‐Scb.
- D, E
Immunohistochemical staining showing the expression of Ki‐67 and CD31 (D) and glucose uptake, lactate production, and ATP levels (E) within subcutaneous xenograft tumors formed by IMR32 cells stably transfected as indicated (n = 5 for each group). Scale bars: 100 μm. Student's t‐test, **P < 0.01 versus mock or sh‐Scb.
- F
Representative images, HE staining (arrowheads), quantification of lung metastatic colonization, and Kaplan–Meier curves of nude mice treated with tail vein injection of IMR32 cells stably transfected as indicated (n = 5 for each group). Scale bar: 100 μm. Student's t‐test, **P < 0.01 versus mock or sh‐Scb. Log‐rank test for survival comparison.
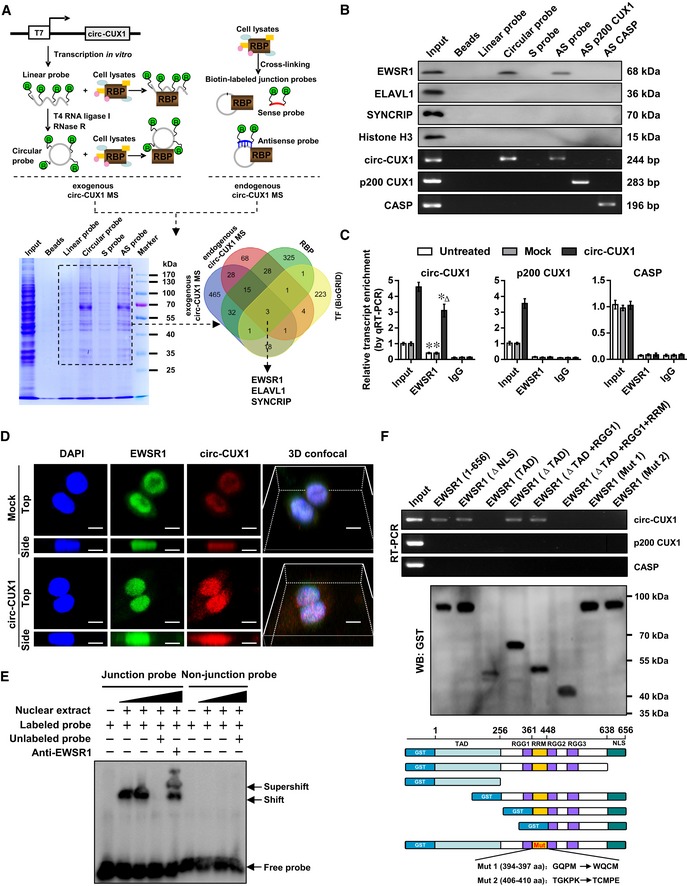
- A
Schematic illustration, Coomassie Blue staining, and Venn diagram showing the differential proteins pulled down by biotin‐labeled linear or circular exogenous circ‐CUX1, sense (S) or antisense (AS) probe targeting junction site of endogenous circ‐CUX1 from IMR32 cells, and over‐lapping analysis with RBP and proteins interacting with potential transcription factors of p200 CUX1 revealed by Genomatix program and BioGRID database.
- B
Western blot (upper panel) and RT–PCR (lower panel) assays indicating the proteins and transcripts pulled down by biotin‐labeled linear or circular exogenous circ‐CUX1, sense (S) or antisense (AS) probe targeting junction site of endogenous circ‐CUX1 from IMR32 cell lysates, using AS probes of p200 CUX1 or CASP as controls.
- C
RIP and real‐time qRT–PCR assays revealing the interaction of EWSR1 with circ‐CUX1, p200 CUX1, or CASP in SH‐SY5Y cells and those stably transfected with empty vector (mock) or circ‐CUX1 (n = 5). Student's t‐test, *P < 0.05 versus IgG; Δ P < 0.01 versus mock.
- D
3D confocal images of dual RNA‐FISH and immunofluorescence staining assay showing the co‐localization of circ‐CUX1 and EWSR1 in IMR32 cells stably transfected with mock or circ‐CUX1. Scale bar: 10 μm.
- E
RNA EMSA determining the interaction between biotin‐labeled circ‐CUX1 probe and EWSR1 protein within nuclear extracts of SH‐SY5Y cells (arrowheads).
- F
In vitro binding assay depicting the recovered circ‐CUX1, p200 CUX1, or CASP detected by RT–PCR (upper panel) after incubation with GST‐tagged recombinant EWSR1 protein validated by Western blot (lower panel).
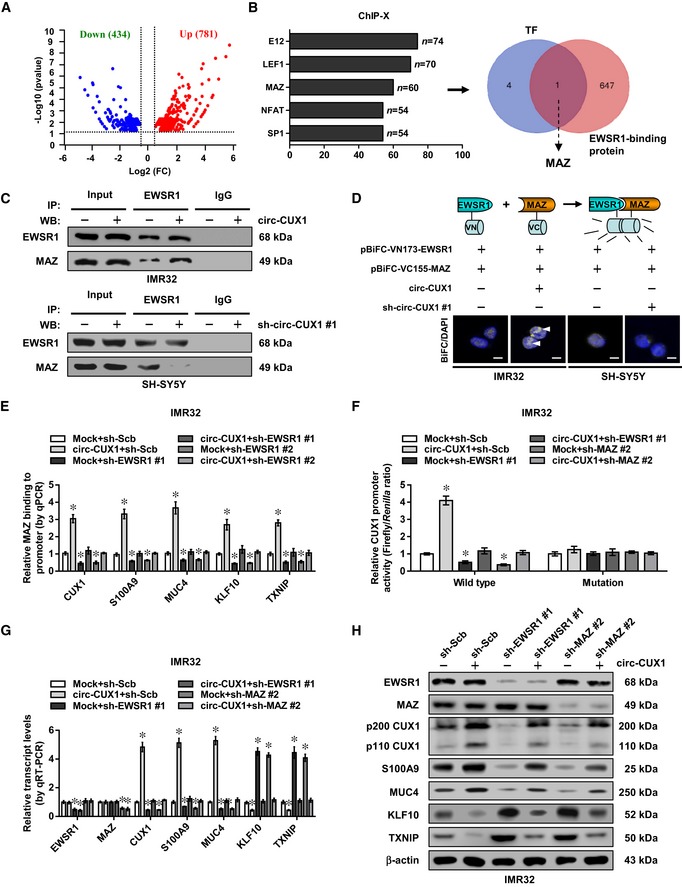
- A
Volcano plots indicating RNA‐seq results of 781 up‐regulated and 434 down‐regulated genes in IMR32 cells upon stable circ‐CUX1 over‐expression (fold change > 1.5, P < 0.05).
- B
ChIP‐X analysis (left panel) showing top five transcription factors regulating the altered genes, and Venn diagram (right panel) indicating the identification of MAZ by over‐lapping analysis of five transcription factors and EWSR1‐interacting proteins derived from BioGRID database.
- C
Co‐IP and Western blot assays showing the interaction between EWSR1 and MAZ in IMR32 and SH‐SY5Y cells stably transfected with circ‐CUX1 or sh‐circ‐CUX1 #1, respectively.
- D
BiFC assay revealing the interaction (arrowheads) of EWSR1 and MAZ in IMR32 and SH‐SY5Y cells stably transfected as indicated, with nuclei stained by DAPI. Scale bars: 10 μm.
- E
ChIP assay showing the binding of MAZ (normalized to input, n = 5) to target gene promoters in IMR32 cells stably transfected as indicated. One‐way ANOVA, *P < 0.05 versus mock+sh‐Scb.
- F
Dual‐luciferase assay revealing the relative activity of p200 CUX1 promoter with wild‐type or mutant MAZ‐binding site in IMR32 cells stably transfected as indicated (n = 5). One‐way ANOVA, *P < 0.05 versus mock+sh‐Scb.
- G, H
Real‐time qRT–PCR (G, normalized to β‐actin, n = 5) and Western blot (H) assays showing the expression of EWSR1, MAZ, and their target genes in IMR32 cells stably transfected as indicated. One‐way ANOVA, *P < 0.05 versus mock+sh‐Scb.
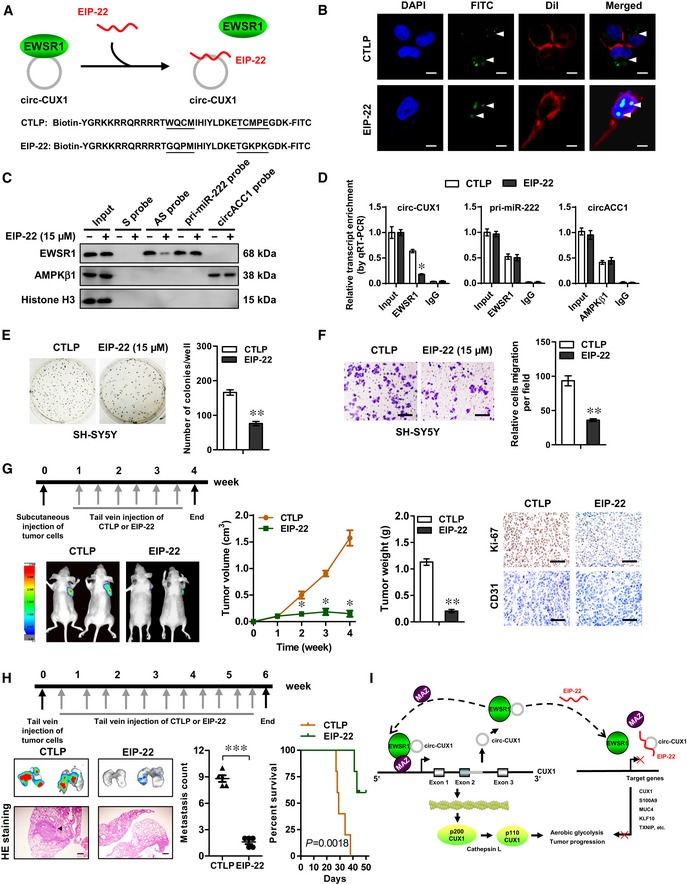
- A, B
Schematic illustration (A) and distribution (arrowheads) (B) of mutant control (CTLP) or inhibitory (EIP‐22) peptide within SH‐SY5Y cells (at 48 h), with nuclei and cellular membrane stained by DAPI or Dil. Scale bars: 10 μm.
- C, D
Western blot (C), RIP, and real‐time qRT–PCR (D, n = 5) assays indicating the proteins (EWSR1, AMPKβ1) and transcripts (circ‐CUX1, pri‐miR‐222, circACC1) pulled down by biotin‐labeled sense (S) or antisense (AS) junction probes of circ‐CUX1, and antisense probes of pri‐miR‐222 or circACC1 in SH‐SY5Y cells treated with CTLP or EIP‐22 (15 μM) for 48 h. Student's t‐test, *P < 0.05 versus IgG.
- E, F
Soft agar (E) and Matrigel invasion (F) assays indicating the growth and invasion of SH‐SY5Y cells treated with CTLP or EIP‐22 (15 μM) for 48 h (n = 5). Scale bars: 100 μm. Student's t‐test, **P < 0.01 versus CTLP.
- G, H
Representative images, in vivo growth curve, tumor weight, Ki‐67 and CD31 expression of xenograft tumors (G) and lung metastatic colonization, and Kaplan–Meier curves (H) of nude mice (n = 5 for each group) treated with subcutaneous or tail vein injection of SH‐SY5Y cells and CTLP or EIP‐22 (5 mg kg−1). Scale bars: 100 μm. One‐way ANOVA, Student's t‐test, **P < 0.01, ***P < 0.001 versus CTLP. Log‐rank test for survival comparison.
- I
Schematic illustration of circ‐CUX1‐promoted tumor progression: circ‐CUX1 binds to EWSR1 to facilitate its interaction with MAZ, resulting in MAZ transactivation and transcriptional alteration of CUX1 and other genes associated with aerobic glycolysis and tumor progression. An inhibitory peptide blocking circ‐CUX1‐EWSR1 interaction suppresses tumor progression.
References
-
- Bensaad K, Tsuruta A, Selak M, Vidal M, Nakano K, Bartrons R, Gottlieb E, Vousden K (2006) TIGAR, a p53‐inducible regulator of glycolysis and apoptosis. Cell 126: 107–120 - PubMed
-
- Bramsen JB, Pakula MM, Hansen TB, Bus C, Langkjær N, Odadzic D, Smicius R, Wengel SL, Chattopadhyaya J, Engels JW et al (2010) A screen of chemical modifications identifies position‐specific modification by UNA to most potently reduce siRNA off‐target effects. Nucleic Acids Res 38: 5761–5773 - PMC - PubMed
-
- Brodeur GM (2003) Neuroblastoma: biological insights into a clinical enigma. Nat Rev Cancer 3: 203–216 - PubMed
-
- Cardaci S, Desideri E, Ciriolo MR (2012) Targeting aerobic glycolysis: 3‐bromopyruvate as a promising anticancer drug. J Bioenerg Biomembr 44: 17–29 - PubMed
Publication types
MeSH terms
Substances
Associated data
- Actions
- Actions
- Actions
- Actions
- Actions
- Actions
Grants and funding
- 2019kfyRCPY032/Fundamental Research Funds for the Central Universities/International
- 81472363/National Natural Science Foundation of China/International
- 81572423/National Natural Science Foundation of China/International
- 81672500/National Natural Science Foundation of China/International
- 81773094/National Natural Science Foundation of China/International
- 81772967/National Natural Science Foundation of China/International
- 81874085/National Natural Science Foundation of China/International
- 81874066/National Natural Science Foundation of China/International
- 81802925/National Natural Science Foundation of China/International
- 81903011/National Natural Science Foundation of China/International
- 81903008/National Natural Science Foundation of China/International
LinkOut - more resources
Full Text Sources
Molecular Biology Databases
Research Materials
