

Cerebrospinal fluid and plasma biomarker trajectories with increasing amyloid deposition in Alzheimer's disease
- PMID: 31709776
- PMCID: PMC6895602
- DOI: 10.15252/emmm.201911170
Cerebrospinal fluid and plasma biomarker trajectories with increasing amyloid deposition in Alzheimer's disease
Abstract
Failures in Alzheimer's disease (AD) drug trials highlight the need to further explore disease mechanisms and alterations of biomarkers during the development of AD. Using cross-sectional data from 377 participants in the BioFINDER study, we examined seven cerebrospinal fluid (CSF) and six plasma biomarkers in relation to β-amyloid (Aβ) PET uptake to understand their evolution during AD. In CSF, Aβ42 changed first, closely followed by Aβ42/Aβ40, phosphorylated-tau (P-tau), and total-tau (T-tau). CSF neurogranin, YKL-40, and neurofilament light increased after the point of Aβ PET positivity. The findings were replicated using Aβ42, Aβ40, P-tau, and T-tau assays from five different manufacturers. Changes were seen approximately simultaneously for CSF and plasma biomarkers. Overall, plasma biomarkers had smaller dynamic ranges, except for CSF and plasma P-tau which were similar. In conclusion, using state-of-the-art biomarkers, we identified the first changes in Aβ, closely followed by soluble tau. Only after Aβ PET became abnormal, biomarkers of neuroinflammation, synaptic dysfunction, and neurodegeneration were altered. These findings lend in vivo support of the amyloid cascade hypotheses in humans.
Keywords: Alzheimer disease; amyloid positron emission tomography; cerebrospinal fluid biomarkers; plasma biomarkers.
© 2019 The Authors. Published under the terms of the CC BY 4.0 license.
Conflict of interest statement
SP, PSI, SJ, ES, and NM report no disclosures. UE is a current employee of the Roche Group. BB is a current employee of EUROIMMUN. JLD and XC are current employees of Lilly. KB has served as a consultant or at advisory boards for Alzheon, BioArctic, Biogen, Eli Lilly, Fujirebio Europe, IBL International, Merck, Novartis, Pfizer, and Roche Diagnostics; is a co‐founder of Brain Biomarker Solutions in Gothenburg AB, a GU Ventures‐based platform company at the University of Gothenburg; and has received research support (for the institution) from Roche Diagnostics and Fujirebio Europe. HZ has served at scientific advisory boards for Roche Diagnostics, Eli Lilly, and Wave; has received travel support from Teva; and is a co‐founder of Brain Biomarker Solutions in Gothenburg AB, a GU Ventures‐based platform company at the University of Gothenburg. OH has acquired research support (for the institution) from Roche, GE Healthcare, Biogen, AVID Radiopharmaceuticals, Fujirebio, and Euroimmun. In the past 2 years, he has received consultancy/speaker fees (paid to the institution) from Lilly, Roche, and Fujirebio.
Figures
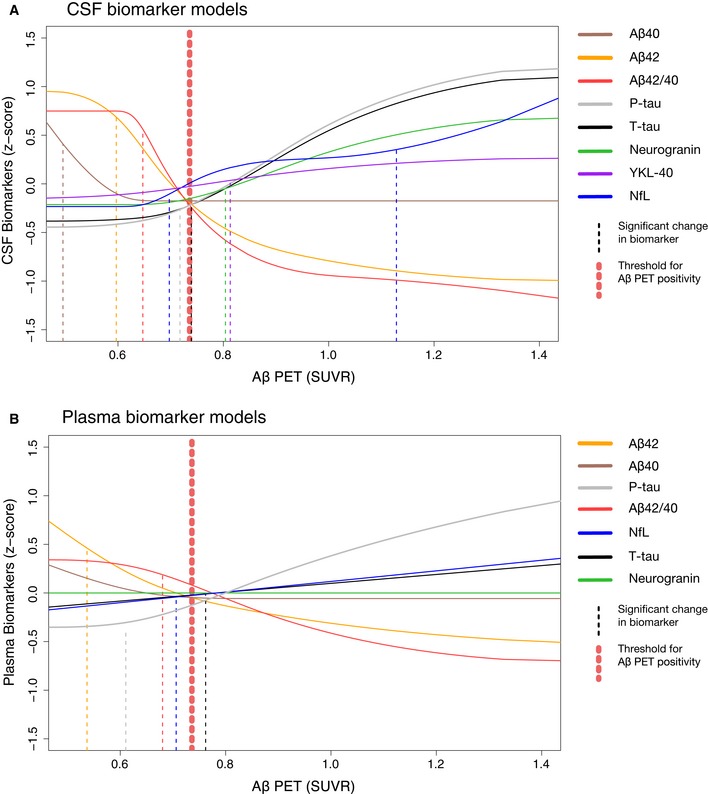
- A, B
The biomarker data were fitted using monotone spline models where Aβ PET SUVR acted as a proxy for time in AD. CSF (A) and plasma (B) biomarkers are shown separately, but selected direct comparisons are shown in Fig 3. Individual spline models with actual data points are shown in Appendix Figs S1 and S2. The threshold for Aβ was established using mixture modeling statistics. Point of change on the trajectory (also referred to as significant biomarker change) is shown as vertical dashed lines. They were defined as a change in 2 SE (derived from 500 bootstrap samples) from the starting point of the modeled trajectory. Note that plasma P‐tau data were missing in 34 cases. To facilitate comparisons between different CSF and plasma biomarkers, the levels have been transformed to z‐scores based on the distribution in the present population (i.e., a z‐score of 0 corresponds to the mean of the study cohort).
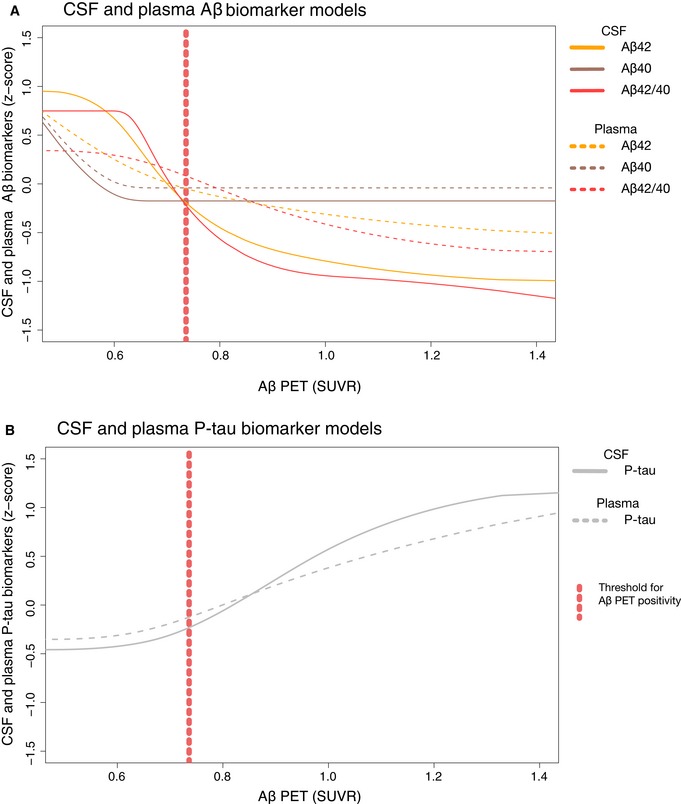
- A
Same models as in Fig 1A and B for CSF and plasma Aβ40, Aβ42, and Aβ42/40, but now in the same panel for easier comparison.
- B
Spline models from the same dataset where there were no missing data for plasma P‐tau (n = 343); i.e., the plasma P‐tau curve is the same as in Fig 1B, but CSF P‐tau is slightly different compared Fig 1A.
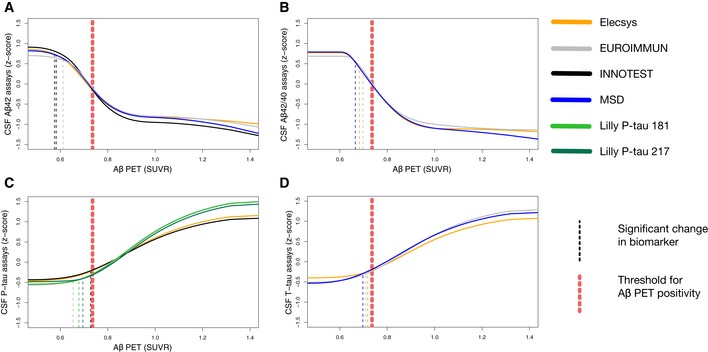
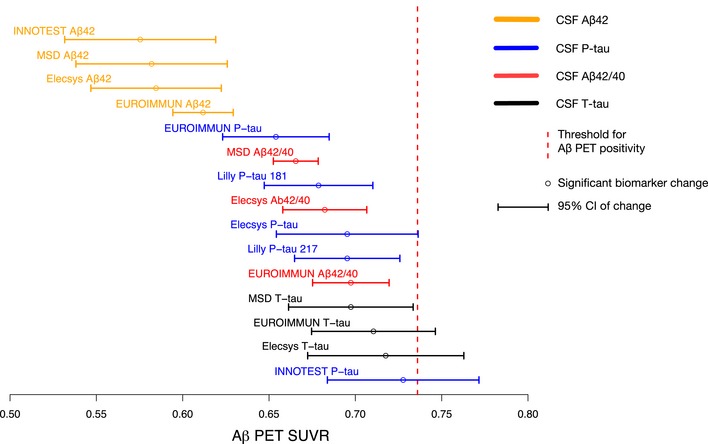
- A–D
The biomarker data were fitted using monotone spline models for CSF Aβ42 (A), Aβ42/40 (B), P‐tau (C), and T‐tau (D) assays, where Aβ PET SUVR acted as a proxy for time in AD. Point of change on the trajectory (also referred to as significant biomarker change) is shown as vertical dashed lines. Significant changes were identified for all biomarkers, but some were almost identical and are therefore partially hidden (see Fig 5 for a better overview of change points). Note that this analysis was performed on a slightly smaller sample where all participants had a complete dataset of all assays (n = 352 vs. n = 377 in the whole population).
References
-
- Benaglia T, Chauveau D, Hunter DR, Young D (2009) mixtools: an R package for analyzing finite mixture models. J Stat Softw 32: 1–29
-
- Bischof GN, Jacobs HIL (2019) Subthreshold amyloid and its biological and clinical meaning: long way ahead. Neurology 93: 72–79 - PubMed
-
- Blennow K, Hampel H, Weiner M, Zetterberg H (2010) Cerebrospinal fluid and plasma biomarkers in Alzheimer disease. Nat Rev Neurol 6: 131–144 - PubMed
Publication types
MeSH terms
Substances
Grants and funding
LinkOut - more resources
Full Text Sources
Other Literature Sources
Medical
