. 2020 Feb 1;318(2):G211-G224.
doi: 10.1152/ajpgi.00040.2019. Epub 2019 Nov 11.

CD8+ T cells regulate liver injury in obesity-related nonalcoholic fatty liver disease

Affiliations

CD8+ T cells regulate liver injury in obesity-related nonalcoholic fatty liver disease

Denitra A Breuer et al. Am J Physiol Gastrointest Liver Physiol. .

Abstract

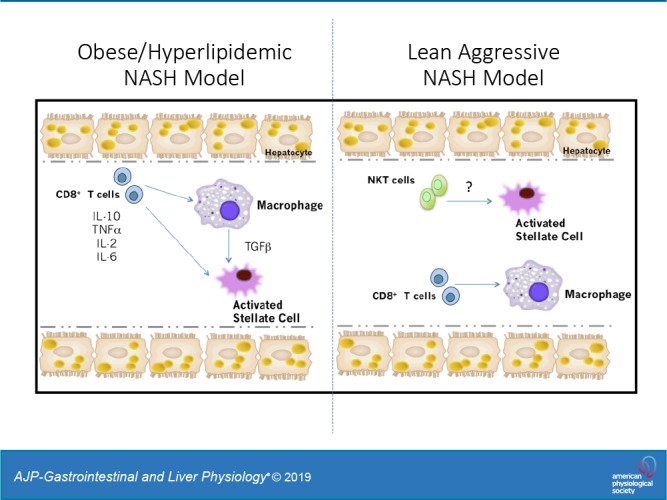
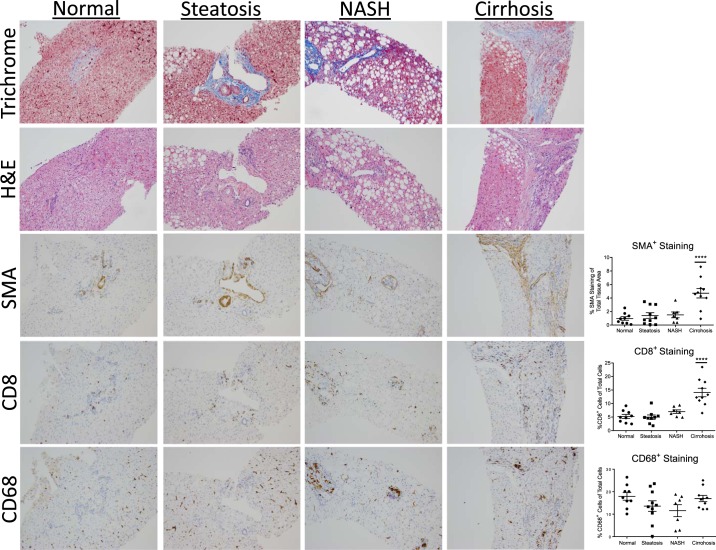
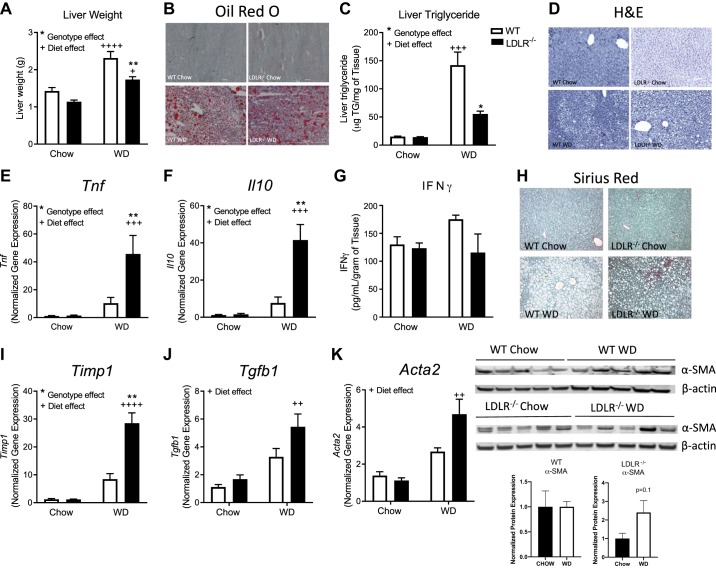
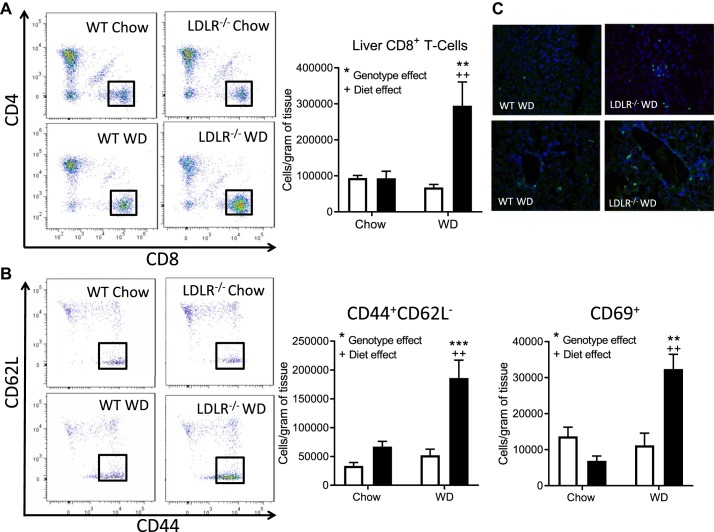
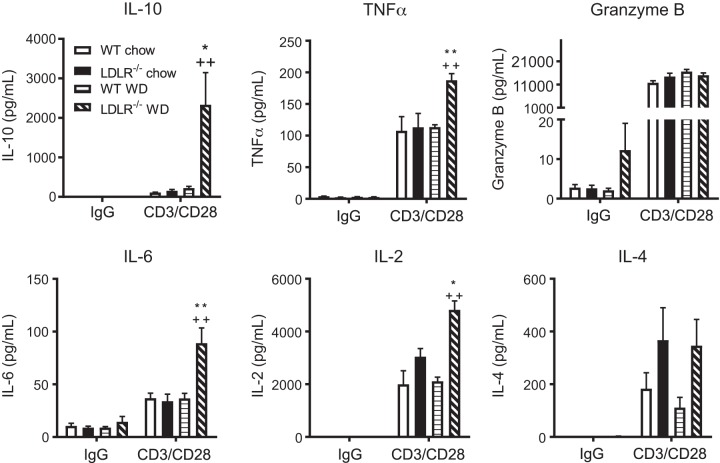
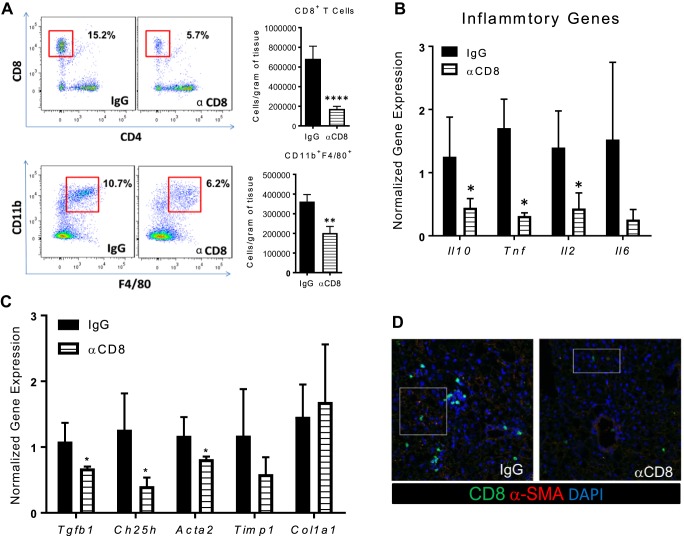
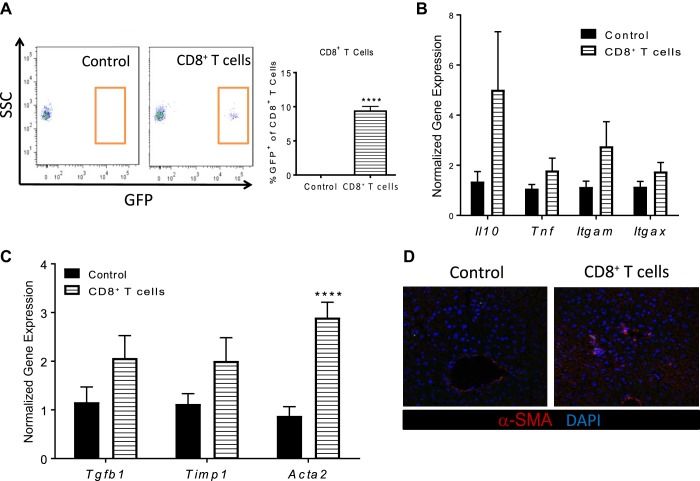
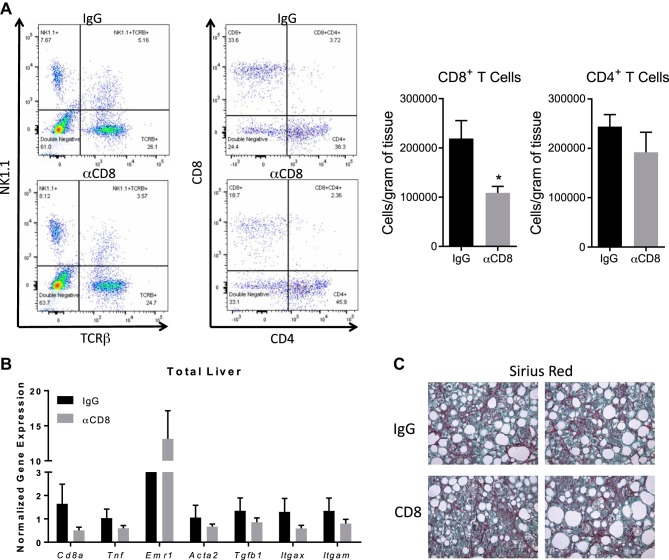
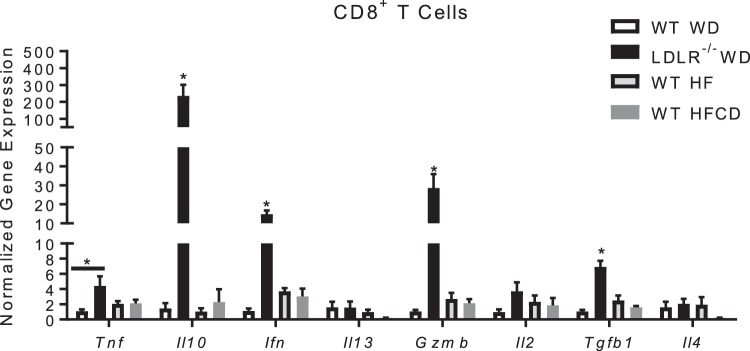
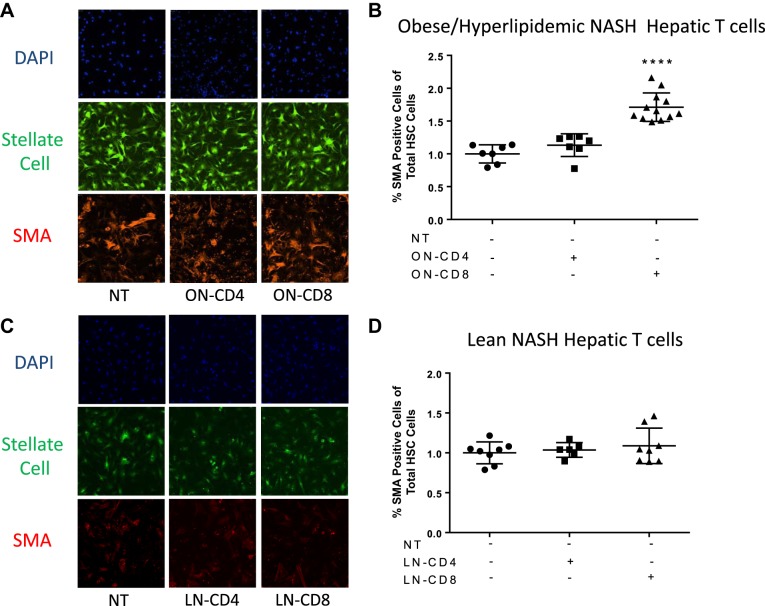
Nonalcoholic steatohepatitis (NASH) has increased in Western countries due to the prevalence of obesity. Current interests are aimed at identifying the type and function of immune cells that infiltrate the liver and key factors responsible for mediating their recruitment and activation in NASH. We investigated the function and phenotype of CD8+ T cells under obese and nonobese NASH conditions. We found an elevation in CD8 staining in livers from obese human subjects with NASH and cirrhosis that positively correlated with α-smooth muscle actin, a marker of hepatic stellate cell (HSC) activation. CD8+ T cells were elevated 3.5-fold in the livers of obese and hyperlipidemic NASH mice compared with obese hepatic steatosis mice. Isolated hepatic CD8+ T cells from these mice expressed a cytotoxic IL-10-expressing phenotype, and depletion of CD8+ T cells led to significant reductions in hepatic inflammation, HSC activation, and macrophage accumulation. Furthermore, hepatic CD8+ T cells from obese and hyperlipidemic NASH mice activated HSCs in vitro and in vivo. Interestingly, in the lean NASH mouse model, depletion and knockdown of CD8+ T cells did not impact liver inflammation or HSC activation. We demonstrated that under obese/hyperlipidemia conditions, CD8+ T cell are key regulators of the progression of NASH, while under nonobese conditions they play a minimal role in driving the disease. Thus, therapies targeting CD8+ T cells may be a novel approach for treatment of obesity-associated NASH.NEW & NOTEWORTHY Our study demonstrates that CD8+ T cells are the primary hepatic T cell population, are elevated in obese models of NASH, and directly activate hepatic stellate cells. In contrast, we find CD8+ T cells from lean NASH models do not regulate NASH-associated inflammation or stellate cell activation. Thus, for the first time to our knowledge, we demonstrate that hepatic CD8+ T cells are key players in obesity-associated NASH.

Keywords: CD8+ T cells; lymphocytes; nonalcoholic steatohepatitis; stellate cells.


Conflict of interest statement

No conflicts of interest, financial or otherwise, are declared by the authors.

Figures

None
Graphical abstract
Fig. 1.
Fig. 1.
Data shown are of one-way ANOVA for CD8, smooth muscle action (SMA), and CD68 staining. CD8+ T cells and SMA expression are elevated during the progression of nonalcoholic fatty liver disease (NAFLD) in obese patients. Top: Human liver tissue sections were obtained from obese patients undergoing bariatric surgery that were diagnosed with normal, steatosis, nonalcoholic steatohepatitis (NASH), or cirrhosis. Bottom: representative images of trichrome staining, H&E, CD8, SMA, and CD68 staining (×20). Staining was quantified using Tissue Image Analysis for the Digital Image Hub. Data represent 8–10 patients per group. ****P < 0.0001.
Fig. 2.
Fig. 2.
LDLR−/− mice on Western diet (WD) represent a model of obesity/hyperlipidemia-induced nonalcoholic steatohepatitis (NASH). Wild-type (WT; open bars) and LDLR−/− (closed bars) mice were placed on chow or WD for 8 wks. Liver weights (A), hepatic lipid measured by Oil red O staining (B) (×10), and liver triglyceride (TG) concentration (C). D: hepatic H&E staining. Liver gene expression of Tnf (E) and Il10 (F) was measured by real-time RT-PCR, and protein levels of IFNγ were measured by ELISA (G). H: hepatic collagen deposition was measured by histological staining with Sirius red. Liver gene expression of Timp1 (I), and Tgfb1 (J) is shown. K: gene and protein expression of total liver alpha-smooth muscle actin (α-SMA). Data are means ± SE of n = 5–9 mice per group. Data analysis: Two-way ANOVA with Tukey correction for A, C, E, F, I, and J. *Genotype effects and +diet effects. * or +P < 0.05, ** or ++P < 0.01, +++P < 0.001, ++++P < 0.0001.
Fig. 3.
Fig. 3.
Hepatic CD8+ effector memory T cells are elevated in obesity/hyperlipidemia-induced NASH. Nonparenchymal cells were isolated from livers of wild-type (WT; open bars) and LDLR−/− (filled bars) mice on chow or Western diet (WD) for 8 wks. A: flow analysis of CD8+ T cells (CD8+TCRβ+). B: flow analysis of effector memory (CD44+CD62L-) and activated (CD69+) CD8+ T cells. C: immunofluorescence imaging of liver sections stained with CD8 (55) and DAPI (blue). Data are means ± SE of n = 5–6 mice per group. Representative images were captured at ×40. Data analysis: Two-way ANOVA with Tukey correction for A and B. *Genotype effects and +diet effects. ** or ++P < 0.01; ***P < 0.001.
Fig. 4.
Fig. 4.
Isolated hepatic CD8+ T cells express an IL-10 phenotype in obesity/hyperlipidemia-induced nonalcoholic steatohepatitis (NASH). Wild-type (WT) and LDLR−/− mice were placed on chow or WD for 8 wks. Mice were euthanized and livers collected for isolation of CD8+ T cells. Isolated CD8+ T cells were stimulated with IgG (control) or CD3/C28 for 72 h. Media was collected and secreted cytokine levels of IL-10, TNFα, Granzyme B, IL-6, IL-2, and IL-4 measured by Luminex. Data are means ± SE of n = 3 mice per group. Data analysis: two-way ANOVA with Tukey correction. *P < 0.05; ** or ++P < 0.01.
Fig. 5.
Fig. 5.
Depletion of hepatic CD8+ T cells reduces liver macrophage populations and alpha-smooth muscle actin (α-SMA) expression in obesity/hyperlipidemia-induced nonalcoholic steatohepatitis (NASH) mice. LDLR−/− mice were placed on Western diet (WD) for 8 wks and injected weekly with IgG or anti-CD8 antibody throughout the duration of the diet. Mice were euthanized and livers isolated for subsequent analysis. A: flow analysis and quantification of hepatic CD8+TCRβ+ and CD11b+F4/80+ cells. B: Il10, Tnf, Il2, and Il6 gene expression in total liver. C: extracellular matrix markers, Tgfb1, Ch25h, Acta2, Timp1, and Col1a1 gene expression in total liver. D: immunofluorescence of liver sections stained with CD8 (55), α-SMA (11), and DAPI (blue) at ×40. Data are means ± SE of n = 10–12 mice per group. Data analysis: unpaired Student’s t-test. *P < 0.05 compared with IgG control group; **P < 0.01; ****P < 0.0001.
Fig. 6.
Fig. 6.
Adoptive transfer of hepatic CD8+ T cells from obesity/hyperlipidemia-induced nonalcoholic steatohepatitis (NASH) mice increases alpha-smooth muscle actin (α-SMA) expression. LDLR−/−;GFP+/+ mice were placed on Western diet (WD) for 8 wks. Mice were euthanized and hepatic CD8+ T cells were isolated from livers. Isolated CD8+ T cells were then injected into wild-type (WT) chow-fed mice and recipient mice were euthanized 24 h after injections. A: flow cytometry analysis of hepatic CD8+TCRβ+GFP+ cells. B: Tnf, Il10, Itgam, Itgax gene expression in total liver. C: Tgfb1, Timp1, and Acta2 gene expression in total liver. D: immunofluorescence of liver sections stained with α-SMA (11) and DAPI (blue) at ×40. Data are means ± SE of n = 5–6 mice per group. Data analysis: unpaired Student’s t-test. ****P < 0.0001.
Fig. 7.
Fig. 7.
CD8+ T cells do not regulate liver inflammation or activate hepatic stellate cells (HSCs) under nonobese nonalcoholic steatohepatitis (NASH) conditions. Wild-type (WT) mice were placed on high-fat diet with 0.1% methionine and deficient in choline (HFCD) diet for 10 wks and injected weekly with IgG or anti-CD8 antibody throughout the duration of the diet. Mice were euthanized, and livers were isolated for subsequent analysis. A: flow cytometric analysis and quantification of hepatic CD8+ and CD4+ T cells. B: gene expression in total liver. C: hepatic collagen deposition was measured by histological staining with Sirius red. Data are means ± SE of n = 10–12 mice per group. Data analysis: unpaired Student’s t-test. *P < 0.05.
Fig. 8.
Fig. 8.
Phenotype of isolated CD8+ T cells from obese nonalcoholic steatohepatitis (NASH) and nonobese NASH model. Nonparenchymal cells were isolated from livers of Western diet (WD)-fed wild-type (WT), WD-fed LDLR−/−, high-fat (HF)-fed WT, and HF diet with 0.1% methionine and deficient in choline (HFCD)-fed WT on diet for 8 wks. FACS sorting and RNA isolation of CD8+ T cells were performed. Gene expression was measured by real-time PCR. Data are means ± SE of n = 3–5 mice per group. Data analysis: two-way ANOVA; *P < 0.05.
Fig. 9.
Fig. 9.
CD8+ T cells isolated from the obesity/hyperlipidemia-induced, but not lean nonalcoholic steatohepatitis (NASH), mice directly activate hepatic stellate cells (HSCs). HSCs were isolated from GFP+/+ chow-fed mice at 18 wks of age. HSCs were plated and incubated for 24 h. CD8+ T cells and CD4+ T cells were isolated from Western diet (WD)-fed LDLR−/− mice (ON) or high-fat diet with 0.1% methionine and deficient in choline (HFCD)-fed wild-type (WT) mice. Isolated T cells were cocultured with plated with HSCs for 3 days. Cells were fixed and stained for alpha-smooth muscle actin (α-SMA) (11). A and C: isolated HSC are fluorescent green and images were obtained by confocal microscopy at ×40. B and D: quantification of the activated HSCs using Image Xpress. Data are means ± SE of n = 3 mice per group. Data analysis: one-way ANOVA; ****P < 0.0001.

References

    1. Alderman CJ, Bunyard PR, Chain BM, Foreman JC, Leake DS, Katz DR. Effects of oxidised low density lipoprotein on dendritic cells: a possible immunoregulatory component of the atherogenic micro-environment? Cardiovasc Res 55: 806–819, 2002. doi:10.1016/S0008-6363(02)00447-9. - DOI - PubMed
    1. Alkhouri N, Tamimi TA, Yerian L, Lopez R, Zein NN, Feldstein AE. The inflamed liver and atherosclerosis: a link between histologic severity of nonalcoholic fatty liver disease and increased cardiovascular risk. Dig Dis Sci 55: 2644–2650, 2010. doi:10.1007/s10620-009-1075-y. - DOI - PubMed
    1. Anderson EK, Hill AA, Hasty AH. Stearic acid accumulation in macrophages induces toll-like receptor 4/2-independent inflammation leading to endoplasmic reticulum stress-mediated apoptosis. Arterioscler Thromb Vasc Biol 32: 1687–1695, 2012. doi:10.1161/ATVBAHA.112.250142. - DOI - PMC - PubMed
    1. Bhattacharjee J, Kirby M, Softic S, Miles L, Salazar-Gonzalez RM, Shivakumar P, Kohli R. Hepatic natural killer T-cell and CD8+ T-cell signatures in mice with nonalcoholic steatohepatitis. Hepatol Commun 1: 299–310, 2017. doi:10.1002/hep4.1041. - DOI - PMC - PubMed
    1. Bieghs V, Van Gorp PJ, Wouters K, Hendrikx T, Gijbels MJ, van Bilsen M, Bakker J, Binder CJ, Lütjohann D, Staels B, Hofker MH, Shiri-Sverdlov R. LDL receptor knock-out mice are a physiological model particularly vulnerable to study the onset of inflammation in non-alcoholic fatty liver disease. PLoS One 7: e30668, 2012. doi:10.1371/journal.pone.0030668. - DOI - PMC - PubMed

Publication types