. 2020 Jan 17;126(2):182-196.
doi: 10.1161/CIRCRESAHA.119.315483. Epub 2019 Nov 11.

Metabolic Remodeling Promotes Cardiac Hypertrophy by Directing Glucose to Aspartate Biosynthesis

Affiliations

Metabolic Remodeling Promotes Cardiac Hypertrophy by Directing Glucose to Aspartate Biosynthesis

Julia Ritterhoff et al. Circ Res. .

Abstract

Rationale: Hypertrophied hearts switch from mainly using fatty acids (FAs) to an increased reliance on glucose for energy production. It has been shown that preserving FA oxidation (FAO) prevents the pathological shift of substrate preference, preserves cardiac function and energetics, and reduces cardiomyocyte hypertrophy during cardiac stresses. However, it remains elusive whether substrate metabolism regulates cardiomyocyte hypertrophy directly or via a secondary effect of improving cardiac energetics.

Objective: The goal of this study was to determine the mechanisms of how preservation of FAO prevents the hypertrophic growth of cardiomyocytes.

Methods and results: We cultured adult rat cardiomyocytes in a medium containing glucose and mixed-chain FAs and induced pathological hypertrophy by phenylephrine. Phenylephrine-induced hypertrophy was associated with increased glucose consumption and higher intracellular aspartate levels, resulting in increased synthesis of nucleotides, RNA, and proteins. These changes could be prevented by increasing FAO via deletion of ACC2 (acetyl-CoA-carboxylase 2) in phenylephrine-stimulated cardiomyocytes and in pressure overload-induced cardiac hypertrophy in vivo. Furthermore, aspartate supplementation was sufficient to reverse the antihypertrophic effect of ACC2 deletion demonstrating a causal role of elevated aspartate level in cardiomyocyte hypertrophy. 15N and 13C stable isotope tracing revealed that glucose but not glutamine contributed to increased biosynthesis of aspartate, which supplied nitrogen for nucleotide synthesis during cardiomyocyte hypertrophy.

Conclusions: Our data show that increased glucose consumption is required to support aspartate synthesis that drives the increase of biomass during cardiac hypertrophy. Preservation of FAO prevents the shift of metabolic flux into the anabolic pathway and maintains catabolic metabolism for energy production, thus preventing cardiac hypertrophy and improving myocardial energetics.

Keywords: aspartic acid; cardiomyocyte; glucose; hypertrophy; metabolism; nucleotides.


Figures
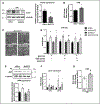
Figure 1.
Figure 1.. ACC2 (acetyl-CoA-carboxylase 2) KD (knockdown) prevents cardiomyocyte hypertrophy in the presence of fatty acids.
A, Representative immunoblot (left) of whole cell lysates and statistical quantification (right) of adult cardiomyocyte (ACM) 72 h after adenoviral shRNA knockdown of ACC2. n=4. B, Quantification of 13C-fatty acid contribution to M+2 citrate to determine fatty acid oxidation (FAO) in control (shScr) and ACC2 KD (shACC2) CMs. n=4. C, Representative images of ACM in glucose+fatty acid (FA) medium with ACC2 KD 24 h after 10 μmol/L phenylephrine (PE) stimulation. Scale bar=100 μm. D, Quantification of cell size 24 h after PE stimulation in indicated media. n=3 to 5. E, Representative immunoblot (left) of whole cell lysates and quantification (right) of ANP (atrial natriuretic peptide) protein expression 24 h after PE stimulation. n=4. F, Gene expression analysis for hypertrophy markers 24 h after PE stimulation. n=6 to 7. G, Quantification of 13C-fatty acid contribution to M+2 citrate to determine FAO 24 h after PE stimulation. The dashed line presents FAO in shScr at baseline. n=4. All data are presented as mean+SEM. P values were determined by unpaired Student t test (A and B) or 1-way ANOVA followed by Tukey multiple comparison test (DG). *P<0.05 vs shScr; #P<0.05 vs shScr+PE. shACC2 indicates short hairpin RNA against ACC2; and shScr, scrambled short hairpin RNA.
Figure 2.
Figure 2.. ACC2 (acetyl-CoA-carboxylase 2) KD (knockdown) suppresses glucose utilization and upregulation of glycolysis during hypertrophic stimulation.
A, Representative fluorescent images (left) and quantification (right) of 2-NBDG uptake 24 h after phenylephrine (PE) stimulation. Scale bar=100 μm. n=4 to 5.B, Quantification of lactate secretion into cell culture medium 24 h after PE stimulation. n=5 to 6. C, Heat map of glycolytic intermediates 24 h after PE stimulation. n=5. D, Schematic depiction of how glucose utilization was increased. E, Quantification of cell size 24 h after PE stimulation under indicated conditions. n=5. F, Quantification of cell size 24 h after PE stimulation under indicated conditions. n=4. All data are presented as mean+SEM. P values were determined by 1-way ANOVA followed by Tukey multiple comparison test. *P<0.05 vs shScr; #P<0.05 vs shScr+PE. shACC2 indicates short hairpin RNA against ACC2; and shScr, scrambled short hairpin RNA.
Figure 3.
Figure 3.. ACC2 (acetyl-CoA-carboxylase 2) KD (knockdown) reduces aspartate and nucleotide levels during hypertrophic stimulation.
A, Heat map depicting tricarboxylic acid (TCA) intermediates and amino acids 24 h after phenylephrine (PE) stimulation (left). B, Quantification of TCA cycle pool size, intracellular aspartate, glutamine, and ribose-5-phosphate levels. n=3 to 5. C, Schematic depiction of how glutamine, aspartate, and ribose-5-phosphate contribute to purine nucleotide generation. D, Quantification of purine nucleotides. n=3 to 4. All data are presented as mean+SEM. P values were determined by 1-way ANOVA followed by Tukey multiple comparison test. AMP indicates adenosine monophosphate; GMP, guanosine monophosphate; IMP, inositol monophosphate; PRPP, phosphoribosyl pyrophosphate; shACC2, short hairpin RNA against ACC2; and shScr, scrambled short hairpin RNA. *P<0.05 vs shScr; #P<0.05 vs shScr+PE.
Figure 4.
Figure 4.. Aspartate supplementation increases RNA and protein synthesis after ACC2 (acetyl-CoA-carboxylase 2) KD (knockdown) during hypertrophy.
A, Representative images (left) and quantification (right) of RNA synthesis by 5-ethynyl uridine (EU) labeling (green) 22 h after phenylephrine (PE) stimulation in control and dimethyl-aspartate (DM-ASP)–treated CMs. Scale bar =50 μm. n=4 to 5. B, Representative image (left) and quantification (right) of protein synthesis by puromycin incorporation 22 h after PE stimulation in control and DM-ASP–treated CMs. Ponceau loading controls are depicted in the Figure V in the Online Data Supplement. n=4 to 5. C, Quantification of cell size 24 h after PE stimulation under indicated conditions. n=4 to 5. D, Quantification of cell size 24 h after PE stimulation under indicated conditions. n=4. E, Quantification of aspartate levels under indicated conditions (normalized to glucose [glc]+fatty acid [FA] shScr). n=4 to 5. All data are presented as mean+SEM. P values were determined by 1-way ANOVA followed by Tukey multiple comparison test. Nucl indicates nucleotides; shACC2, short hairpin RNA against ACC2; and shScr, scrambled short hairpin RNA. *P<0.05 vs shScr; #P<0.05 vs shScr+PE.
Figure 5.
Figure 5.. Glutamine (GLN) utilization in tricarboxylic acid (TCA) cycle does not regulate aspartate (ASP) synthesis during hypertrophy.
A, Schematic depiction how glucose and GLN utilization in the TCA cycle support ASP synthesis. B, Quantification of ASP consumption from cell culture medium 24 h after phenylephrine (PE) stimulation. n=5. C, Quantification of GLN and glucose consumption from cell culture medium 24 h after PE stimulation. n=5. D, Schematic depiction of U-13C GLN entry into TCA cycle and labeling pattern of derived metabolites. E, Quantification of M+5 GLN, M+5 glutamate (GLU), and M+5 alpha-ketoglutarate (aKG). n=3 to 4. F, Quantification of M+3 and M+4 ASP. n=3 to 4. All data are presented as mean+SEM. P values were determined by 1-way ANOVA followed by Tukey multiple comparison test. *P<0.05 vs shScr; #P<0.05 vs shScr+PE. shACC2 indicates short hairpin RNA against ACC2; and shScr, scrambled short hairpin RNA.
Figure 6.
Figure 6.. ACC2 (acetyl-CoA-carboxylase 2) KD (knockdown) prevents glucose-derived aspartate (ASP) synthesis in the tricarboxylic acid (TCA) cycle.
A, Schematic depiction of U-13C glucose utilization into TCA cycle and labeling pattern of derived metabolites. B, Quantification of M+3 labeling of lactate (LAC). n=6. C, Quantification of M+2 and M+3 labeling of citrate (CIT). n=6. D, Quantification of M+2 and M+3 labeling of ASP. n=5. E, Quantification of M+2 labeling of alpha-ketoglutarate (aKG), glutamate (GLU), and glutamine (GLN). n=6. F, Schematic depiction of 15N-aspartate’s contribution to adenosine monophosphate (AMP). G, Quantification of intracellular ASP levels (normalized to glucose [glc]+fatty acid [FA] shScr, left) and M+1 ASP (right) after 10 mmol/L 15N-aspartate treatment for 24 h. n=3 to 4. H, Quantification of M+1 AMP after 15N-aspartate treatment. n=3 to 4. All data are presented as mean+SEM. P values were determined by 1-way ANOVA followed by Tukey multiple comparison test. FUM indicates fumarate; MAL, malate; OAA, oxalacetate; PYR, pyruvate; shACC2, short hairpin RNA against ACC2; shScr, scrambled short hairpin RNA; and SUCC, succinate. *P<0.05 vs shSCr; #P<0.05 vs shScr+phenylephrine (PE).
Figure 7.
Figure 7.. Preservation of fatty acid oxidation (FAO) in vivo reduces glucose-derived aspartate (ASP) synthesis.
A, Representative image of heart sections from ACC2 (acetyl-CoA-carboxylase 2) KO (knockout) and control littermates after sham or transverse aortic constriction (TAC) surgery stained with Wheat Germ Agglutinin (WGA) for cardiac hypertrophy. Scale bar=100 μm. B, Quantification for ASP in control and ACC2 KO 2 wk after sham or TAC surgery. n=6 to 8. C, Quantification of M+2 and M+3 labeling of citrate (CIT) and glutamate (GLU). n=5 to 6. D, Quantification of M+2 and M+3 labeling of ASP. n=5 to 7. E, Schematic depiction how FAO prevents CM hypertrophy. All data are presented as mean+SEM. P values were determined by 1-way ANOVA followed by Tukey multiple comparison test. PPP indicates pentose phosphate pathway. *P<0.05 vs control sham; #P<0.05 vs WT TAC.

Comment in

  • Fueling Cardiac Hypertrophy.
    Matsuura TR, Leone TC, Kelly DP. Matsuura TR, et al. Circ Res. 2020 Jan 17;126(2):197-199. doi: 10.1161/CIRCRESAHA.119.316358. Epub 2020 Jan 16. Circ Res. 2020. PMID: 31944916 Free PMC article. No abstract available.

References

    1. Levy D, Garrison RJ, Savage DD, Kannel WB, Castelli WP. Prognostic implications of echocardiographically determined left ventricular mass in the Framingham Heart Study. N Engl J Med. 1990;322:1561–1566. doi: 10.1056/NEJM199005313222203 - DOI - PubMed
    1. Schiattarella GG, Hill JA. Inhibition of hypertrophy is a good therapeutic strategy in ventricular pressure overload. Circulation. 2015;131:1435–1447. doi: 10.1161/CIRCULATIONAHA.115.013894 - DOI - PMC - PubMed
    1. Barger PM, Kelly DP. Fatty acid utilization in the hypertrophied and failing heart: molecular regulatory mechanisms. Am J Med Sci. 1999;318:36–42. doi: 10.1097/00000441-199907000-00006 - DOI - PubMed
    1. Allard MF, Schönekess BO, Henning SL, English DR, Lopaschuk GD. Contribution of oxidative metabolism and glycolysis to ATP production in hypertrophied hearts. Am J Physiol. 1994;267:H742–H750. doi: 10.1152/ajpheart.1994.267.2.H742 - DOI - PubMed
    1. Ritterhoff J, Tian R. Metabolism in cardiomyopathy: every substrate matters. Cardiovasc Res. 2017;113:411–421. doi: 10.1093/cvr/cvx017 - DOI - PMC - PubMed

Publication types