. 2019 Dec 2;129(12):5501-5517.
doi: 10.1172/JCI125519.

FOXM1 drives proximal tubule proliferation during repair from acute ischemic kidney injury

Affiliations

FOXM1 drives proximal tubule proliferation during repair from acute ischemic kidney injury

Monica Chang-Panesso et al. J Clin Invest. .

Abstract

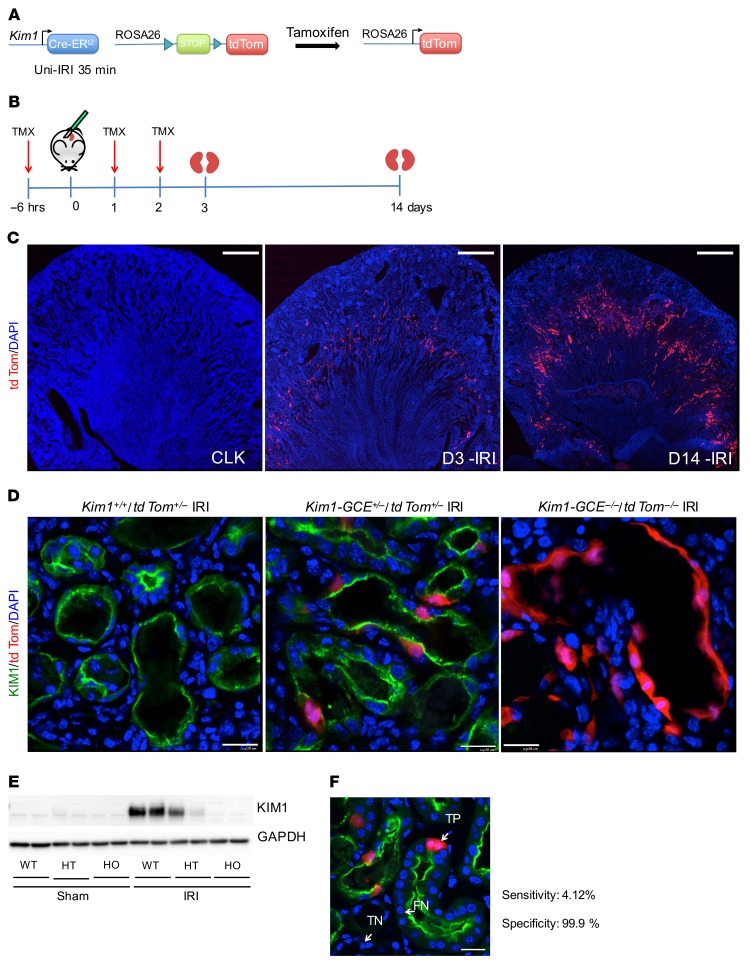
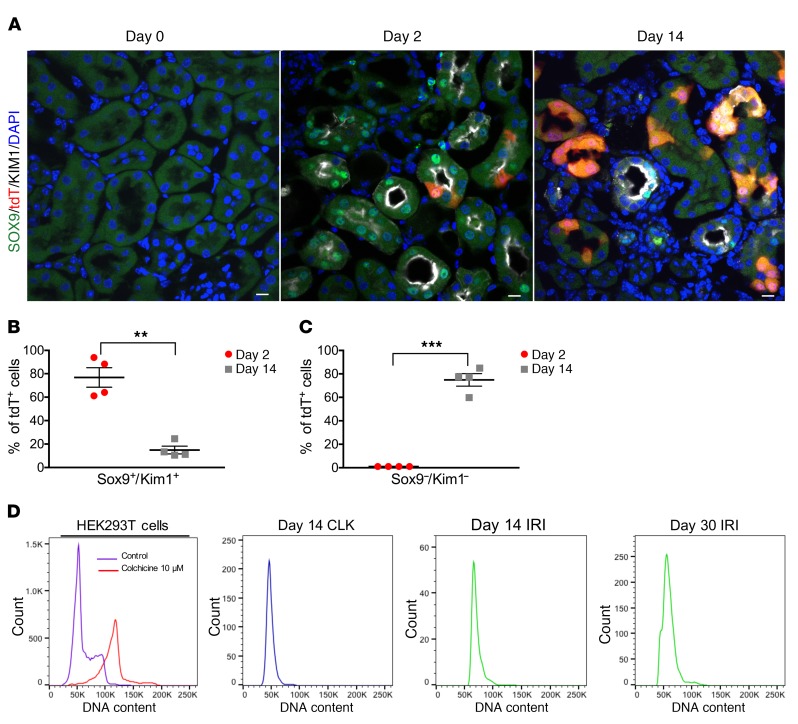
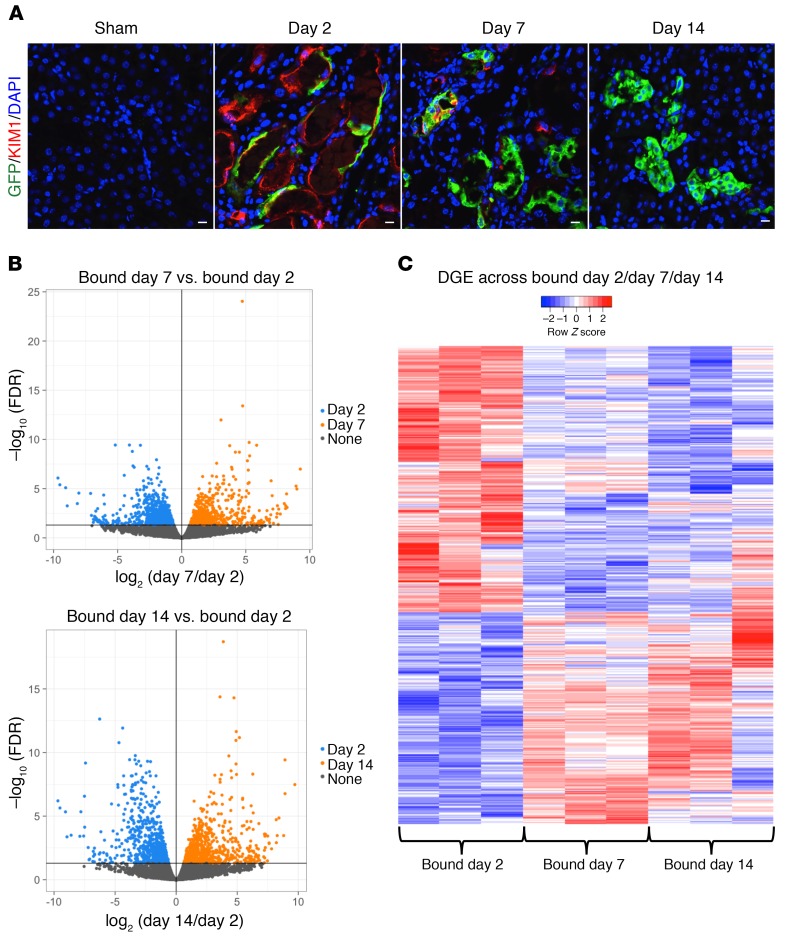
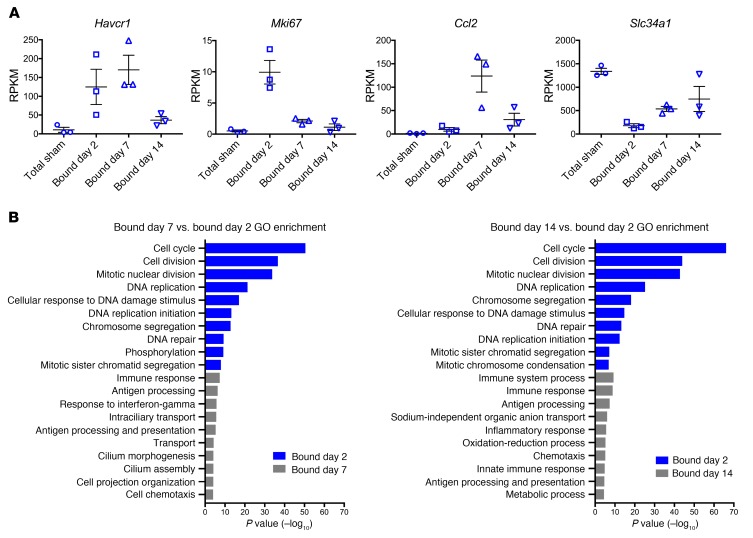
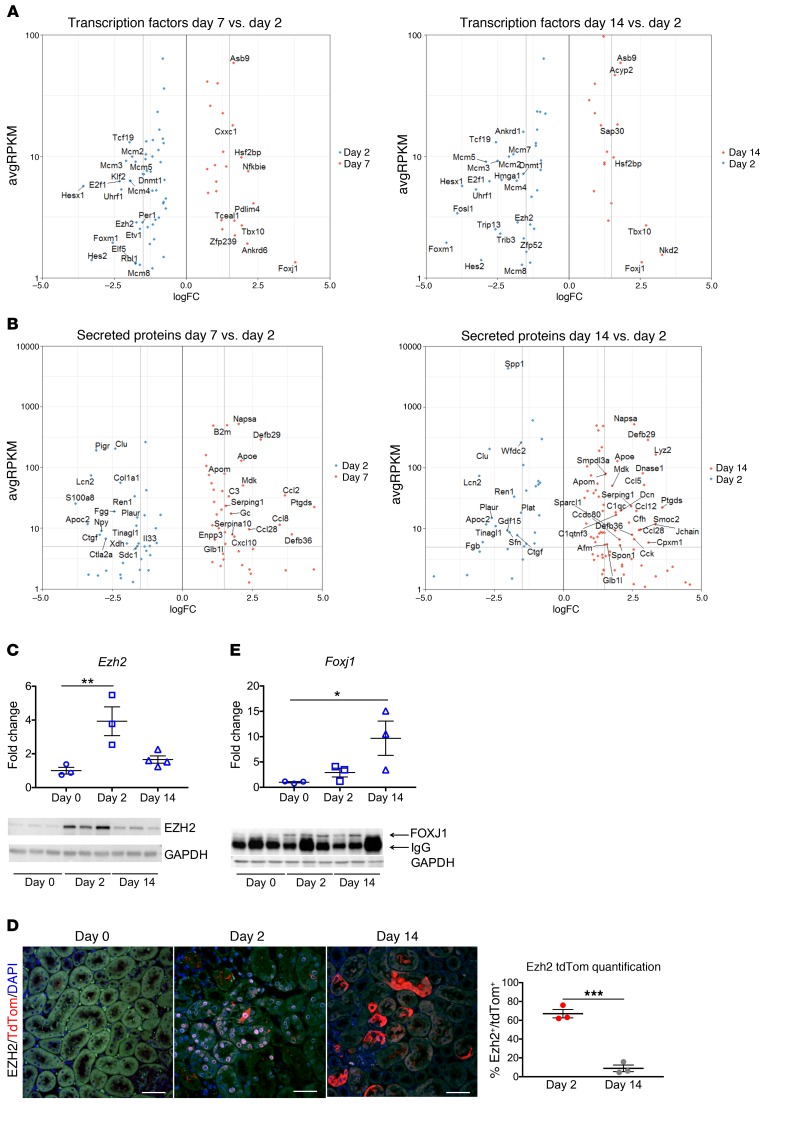
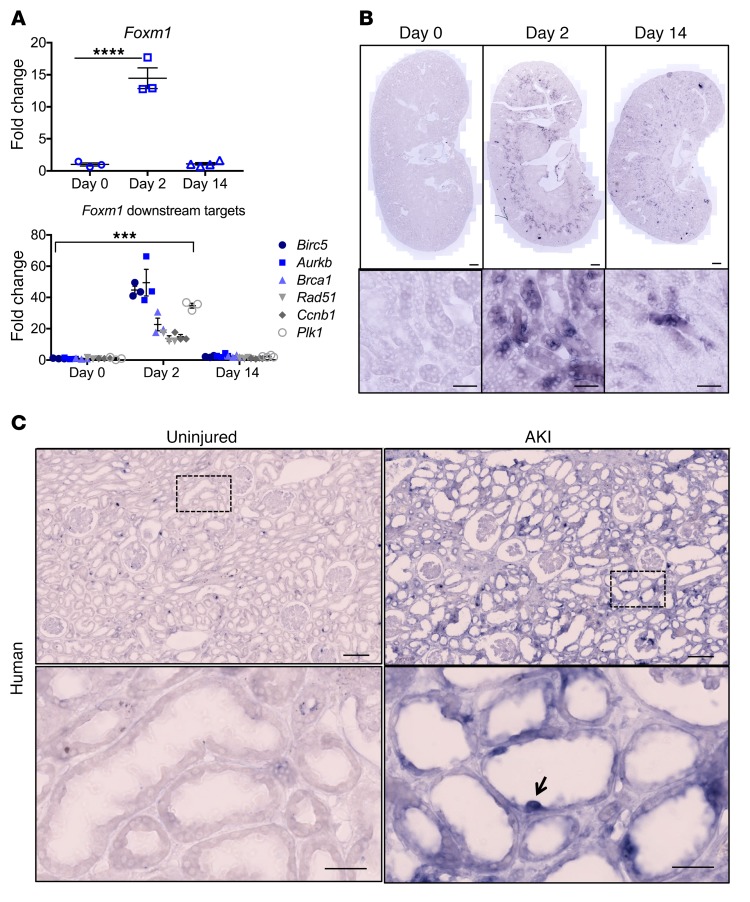
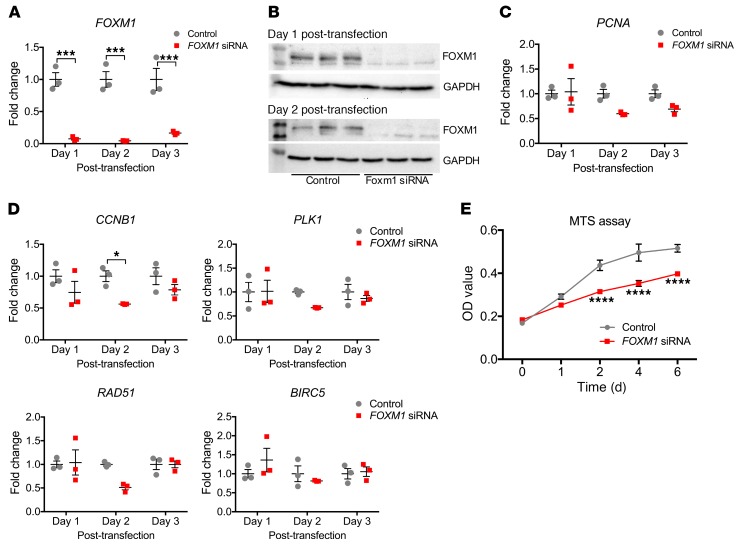
The proximal tubule has a remarkable capacity for repair after acute injury, but the cellular lineage and molecular mechanisms underlying this repair response are incompletely understood. Here, we developed a Kim1-GFPCreERt2 knockin mouse line (Kim1-GCE) in order to perform genetic lineage tracing of dedifferentiated cells while measuring the cellular transcriptome of proximal tubule during repair. Acutely injured genetically labeled clones coexpressed KIM1, VIMENTIN, SOX9, and KI67, indicating a dedifferentiated and proliferative state. Clonal analysis revealed clonal expansion of Kim1+ cells, indicating that acutely injured, dedifferentiated proximal tubule cells, rather than fixed tubular progenitor cells, account for repair. Translational profiling during injury and repair revealed signatures of both successful and unsuccessful maladaptive repair. The transcription factor Foxm1 was induced early in injury, was required for epithelial proliferation in vitro, and was dependent on epidermal growth factor receptor (EGFR) stimulation. In conclusion, dedifferentiated proximal tubule cells effect proximal tubule repair, and we reveal an EGFR/FOXM1-dependent signaling pathway that drives proliferative repair after injury.

Keywords: Adult stem cells; Nephrology; Stem cells.


Conflict of interest statement

Conflict of interest: BDH is a scientific cofounder of and holds equity in Chinook Therapeutics, a biotechnology company seeking to develop drugs to treat kidney diseases. His laboratory also receives research support from Chinook Therapeutics and Janssen Research & Development, LLC. He has consulted for Chinook Therapeutics, Janssen Research & Development, LLC, and Indalo Therapeutics.

Figures

Figure 1
Figure 1. Kim1-GCE mouse model.
(A) Kim1-GCE was crossed to the Rosa26tdTomato reporter mouse to allow permanent labeling of injured tubular epithelial cells upon tamoxifen-mediated recombination. (B) Uni-IRI was performed to validate the mouse model with kidneys harvested at day 3 and day 14 after injury. (C) Immunofluorescent staining showing endogenous tdTomato expression in the outer segment of the outer medulla at day 3 with increased expression at day 14. There is absence of tdTomato expression in the contralateral kidney after tamoxifen administration indicating no leaky expression. (D) Immunostaining with KIM1 antibody showing coexpression with tdTomato-labeled cells in Kim1-GCE heterozygous mice. There is absence of KIM1 expression in Kim1-GCE homozygous mice, as expected since this a knockin to the ATG site. (E) Western blot for KIM1 showing half the amount of protein expressed in Kim1-GCE heterozygous as compared with WT mice and absence of KIM1 protein in Kim1-GCE homozygous consistent with immunofluorescent staining. (F) Immunostaining showing examples of TP, TN, and FN for determination of sensitivity and specificity for the mouse model. n= 3–4 mice. Scale bars: 500 μM (C); 20 μM (D and F).
Figure 2
Figure 2. Lineage tracing of injured tubular epithelial cells.
(A) Kim1-GCE;tdTom mice heterozygous for both alleles were subjected to Bi-IRI or Uni-IRI and low-dose tamoxifen (TMX) (1 mg) administered 12 hours after surgery. (B) Immunostaining showing single tdTom cells labeled at day 2 after injury and clusters of tdTom cells at day 14 in Bi-IRI and Uni-IRI. (C) Quantification of clone size at day 2 and day 14 after injury. (D) Immunostaining for PAX2, VIMENTIN, and KI67 showing coexpression with tdTom cells at day 2. By day 14, there is persistent PAX2 and VIMENTIN expression in tdTom cells. KI67 is absent from tdTom cells at day 14, since the cells have completed repair. Quantification showing percentages of coexpression of the tdTom cells with each of the markers. For AC, n = 4–6 mice per experiment. For D, n = 3–4 mice. Scale bars: 10 μM. *P < 0.05; ***P < 0.001; ****P < 0.0001, 2-way ANOVA with post hoc Dunnett’s multiple comparisons test (C) and Student’s t test (D).
Figure 3
Figure 3. SOX9 immunostaining reveals a population of proximal tubule cells that have failed to repair with no evidence for endocycle.
(A) Immunostaining for SOX9 shows absence at baseline (day 0), but expression in tdTom cells upon injury (day 2). At day 14, there are a few tdTom cells that have persistent SOX9 expression, suggesting that these are cells that have failed repair. Scale bars: 10 μM. (B) Quantification of percentages of tdTom cells that express both SOX9 and KIM1 at day 2 and day 14. (C) Quantification of the percentages of tdTom cells that do not express SOX9 and KIM1 at day 2 and day 14. (D) DNA content analysis. Far left, HEK293T cells treated with colchicine used as a positive control for polyploidy. Sorted tdTomato+ cells from CLK and IRI kidneys at the designated time points show no polyploidy. For AC, n = 4 mice per time point were used for analysis. For D, representative experiments are shown from n = 4 independent experiments for each time point. **P < 0.01; ***P < 0.001, Student’s t test.
Figure 4
Figure 4. Transcriptional profiling of injured tubular epithelial cells.
(A) Immunostaining for GFP in bigenic Kim1-GCE;EGFPL10a kidney sections shows absent GFP expression in sham and coexpression with tdTom cells at day 2 after injury. There are increases in GFP expression at day 7 and day 14, since there is clonal expansion of the surviving tubular epithelial cells. Scale bars: 10 μM. (B) Volcano plots of the DGE list for bound day 7 versus bound day 2 and bound day 14 versus day 2. (C) Heatmap of the DGE list across all 3 time points. n = 3 mice for each time point.
Figure 5
Figure 5. Validation and DAVID GO Analysis of differentially expressed genes in injured tubular epithelial cells.
(A) RPKM values across different time points after injury of known upregulated and downregulated genes. (B) GO analysis of the 2 comparisons: bound day 7 versus day 2 and bound day 14 versus day 2. For all experiments, n = 3 replicates.
Figure 6
Figure 6. Validation of candidate genes Slc22a7, Rrm2, Ctss, and Sprr2f.
(A) ISH in kidney sections from adult, male C57BL/6 mouse at 3 different time points after Bi-IRI. Scale bars: 500 μM (upper panels); 50 μM (lower panels). (B) qPCR in whole kidney lysates for the candidate genes. Representative results from n = 3–4 independent samples per time point. *P < 0.05; ***P < 0.001; ****P < 0.0001, 1-way ANOVA with post hoc Dunnett’s multiple comparisons test.
Figure 7
Figure 7. Transcription factors and secreted proteins identified during translational profiling of injured tubular epithelial cells.
(A and B) Scatter plots showing some of the upregulated and downregulated transcription factors and secreted proteins when comparing bound day 7 versus day 2 and bound day 14 versus day 2. (C) Ezh2 mRNA and protein expressions by qPCR and Western blot, respectively, showing upregulation at day 2 and downregulation by day 14. (D) Immunostaining and quantification for EZH2 shows coexpression in tdTomato-labeled cells at day 2 and almost complete absence by day 14 when repair is complete. (E) Foxj1 mRNA and protein expression by qPCR and Western blot. There is increased Foxj1 mRNA expression at day 2 after injury, with further upregulation by day 14. At the protein level, FOXJ1 expression is increased at day 2 compared with day 0 and continues to be expressed by day 14. Scale bars: 50 μM. n = 3–4 samples per time point. *P < 0.05; **P < 0.01; ***P < 0.001, 1-way ANOVA with post hoc Dunnett’s multiple comparisons test.
Figure 8
Figure 8. Foxm1 is expressed after kidney injury in mouse and human.
(A) mRNA expression of Foxm1 and its downstream targets after injury. (B) ISH in uninjured and injured mouse kidneys sections showing increased expression in the outer segment of the outer medulla at day 2 and significant downregulation at day 14. Scale bars: 500 μM (upper panels); 50 μM (lower panels). (C) ISH in human samples from uninjured and injured kidney showing absent FOXM1 expression in the uninjured kidney and expression in cells from injured tubules. Scale bars: 200 μM (upper panels); 50 μM (lower panels). For A and B, n = 3–4 mice per time point. For C, n = 1 for each condition. ***P < 0.001; ****P < 0.0001, 2-way ANOVA with post hoc Dunnett’s multiple comparisons test.
Figure 9
Figure 9. Foxm1 drives proximal tubular epithelial proliferation.
(A) qPCR for FOXM1 showing efficient FOXM1 siRNA knockdown in hRPTECs at different time points after transfection. (B) Western blot for FOXM1 in hRPTECs corroborating siRNA knockdown. (C) PCNA mRNA expression in control and FOXM1 siRNA–treated hRPTECs. (D) qPCR for FOXM1 downstream genes in hRPTECs treated with FOXM1 siRNA versus control. (E) MTS assay in hRPTECs shows decrease proliferation in FOXM1 siRNA–treated cells compared with control. n = 3 replicates for each time point, except MTS assay, which was done on n = 6 per each day evaluated. *P < 0.05; ***P < 0.001; ****P < 0.0001, 2-way ANOVA with post hoc Bonferroni’s multiple comparisons test.
Figure 10
Figure 10. Foxm1 is downstream of the Egfr pathway in tubular epithelial proliferation.
(A) mRNA expression for FOXM1 and several of its downstream targets in hRPTECs after treatment with erlotinib. (B) Western blot in lysates of hRPTECs treated with erlotinib versus vehicle. There is complete absence of FOXM1 protein upon inhibition of EGFR with erlotinib, indicating that FOXM1 is downstream of the EGFR pathway. Lack of phosphor-EGFR expression confirms inhibition of EGFR by erlotinib. (C–E) qPCR for Foxm1, Plk1, and Ki67 2 days after IRI in mice of different strains treated with erlotinib and vehicle. For cell culture experiments, n = 3 replicates per group. For in vivo experiments, n = 3–5 mice per group. *P < 0.05; **P < 0.01; ***P < 0.001; ****P < 0.0001, 2-way ANOVA with post hoc Bonferroni’s multiple comparisons test.

Comment in

References

    1. Pavkov ME, Harding JL, Burrows NR. Trends in hospitalizations for acute kidney injury - United States, 2000-2014. MMWR Morb Mortal Wkly Rep. 2018;67(10):289–293. - PMC - PubMed
    1. Saran R, et al. US Renal Data System 2017 Annual Data Report: Epidemiology of Kidney Disease in the United States. Am J Kidney Dis. 2018;71(3 Suppl 1):A7. - PMC - PubMed
    1. Takaori K, et al. Severity and frequency of proximal tubule injury determines renal prognosis. J Am Soc Nephrol. 2016;27(8):2393–2406. doi: 10.1681/ASN.2015060647. - DOI - PMC - PubMed
    1. Humphreys BD, et al. Intrinsic epithelial cells repair the kidney after injury. Cell Stem Cell. 2008;2(3):284–291. doi: 10.1016/j.stem.2008.01.014. - DOI - PubMed
    1. Humphreys BD, Czerniak S, DiRocco DP, Hasnain W, Cheema R, Bonventre JV. Repair of injured proximal tubule does not involve specialized progenitors. Proc Natl Acad Sci U S A. 2011;108(22):9226–9231. doi: 10.1073/pnas.1100629108. - DOI - PMC - PubMed

Publication types