. 2019 Nov 11;15(11):e1008458.
doi: 10.1371/journal.pgen.1008458. eCollection 2019 Nov.

Microbial phenotypic heterogeneity in response to a metabolic toxin: Continuous, dynamically shifting distribution of formaldehyde tolerance in Methylobacterium extorquens populations

Affiliations

Microbial phenotypic heterogeneity in response to a metabolic toxin: Continuous, dynamically shifting distribution of formaldehyde tolerance in Methylobacterium extorquens populations

Jessica A Lee et al. PLoS Genet. .

Erratum in

Abstract

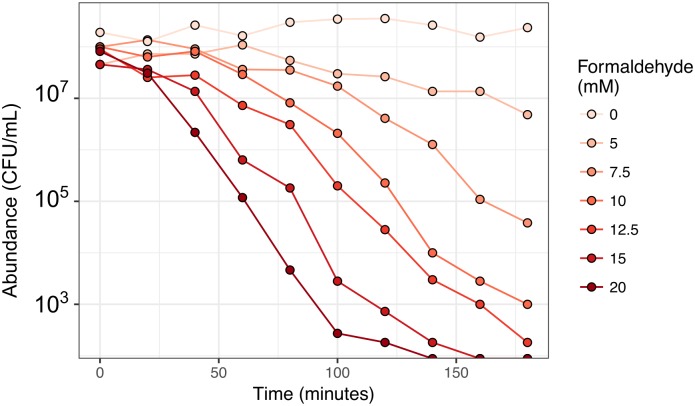
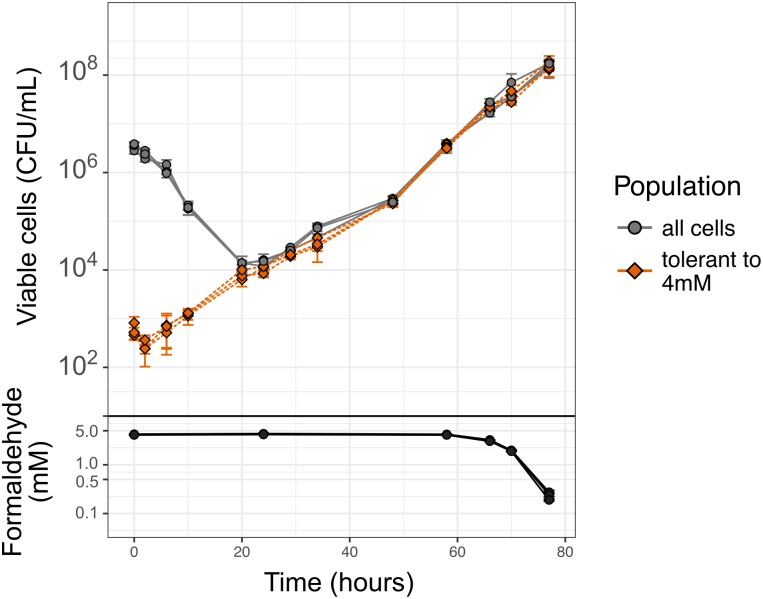
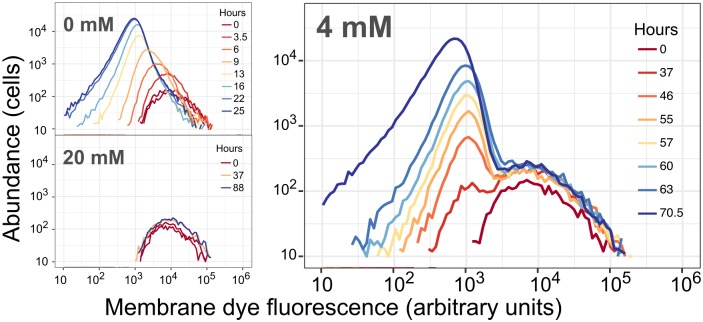
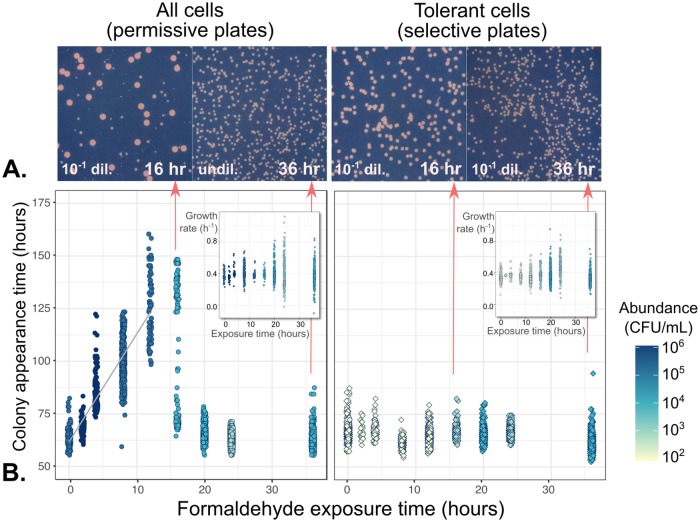
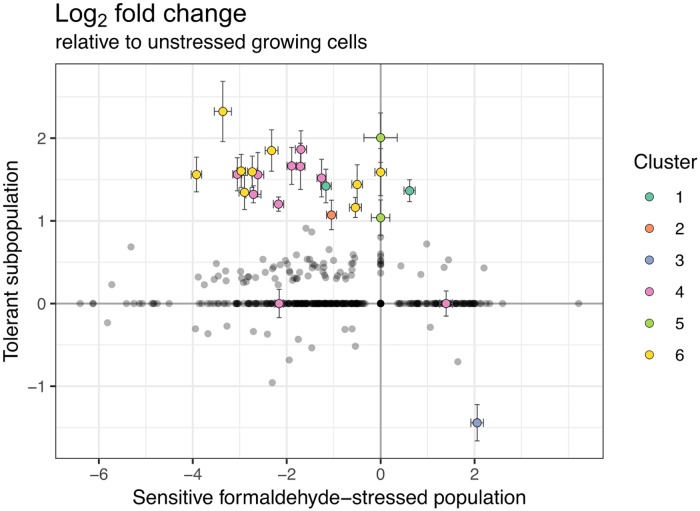
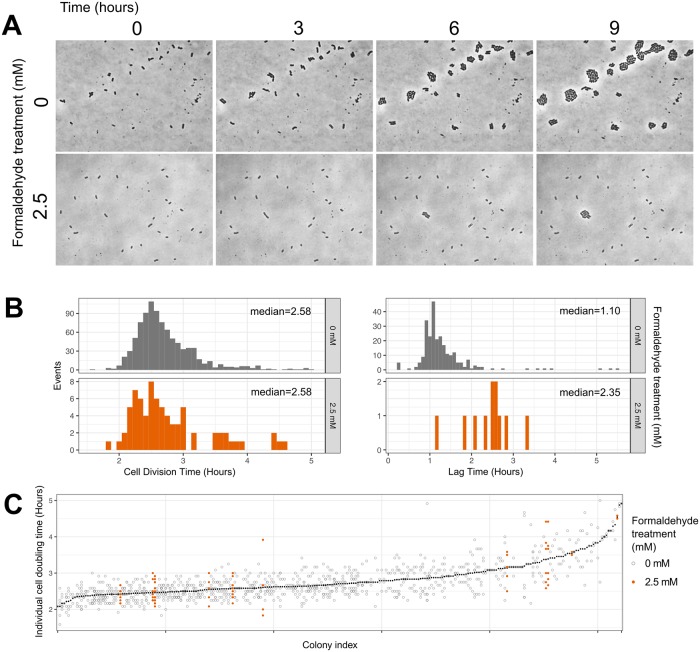
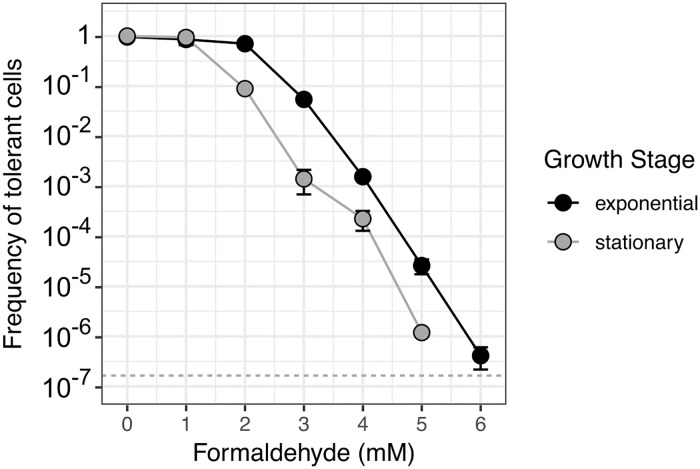
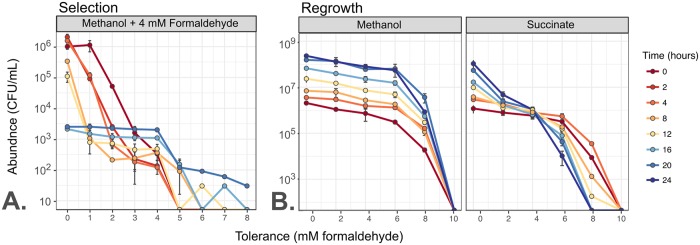
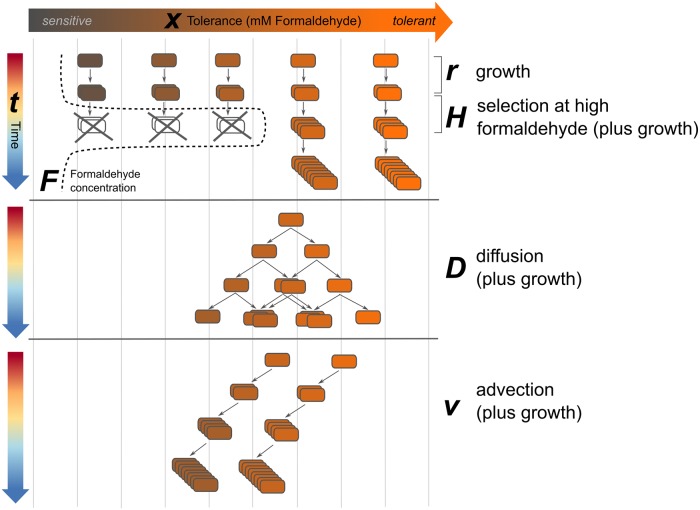
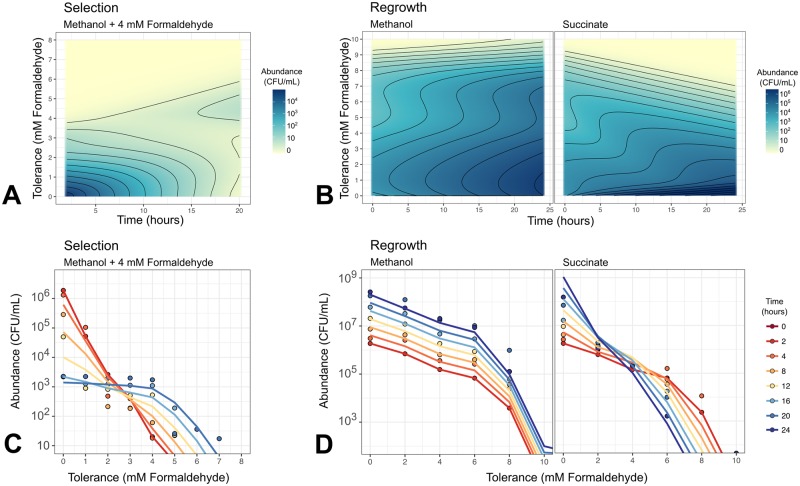
While microbiologists often make the simplifying assumption that genotype determines phenotype in a given environment, it is becoming increasingly apparent that phenotypic heterogeneity (in which one genotype generates multiple phenotypes simultaneously even in a uniform environment) is common in many microbial populations. The importance of phenotypic heterogeneity has been demonstrated in a number of model systems involving binary phenotypic states (e.g., growth/non-growth); however, less is known about systems involving phenotype distributions that are continuous across an environmental gradient, and how those distributions change when the environment changes. Here, we describe a novel instance of phenotypic diversity in tolerance to a metabolic toxin within wild-type populations of Methylobacterium extorquens, a ubiquitous phyllosphere methylotroph capable of growing on the methanol periodically released from plant leaves. The first intermediate in methanol metabolism is formaldehyde, a potent cellular toxin that is lethal in high concentrations. We have found that at moderate concentrations, formaldehyde tolerance in M. extorquens is heterogeneous, with a cell's minimum tolerance level ranging between 0 mM and 8 mM. Tolerant cells have a distinct gene expression profile from non-tolerant cells. This form of heterogeneity is continuous in terms of threshold (the formaldehyde concentration where growth ceases), yet binary in outcome (at a given formaldehyde concentration, cells either grow normally or die, with no intermediate phenotype), and it is not associated with any detectable genetic mutations. Moreover, tolerance distributions within the population are dynamic, changing over time in response to growth conditions. We characterized this phenomenon using bulk liquid culture experiments, colony growth tracking, flow cytometry, single-cell time-lapse microscopy, transcriptomics, and genome resequencing. Finally, we used mathematical modeling to better understand the processes by which cells change phenotype, and found evidence for both stochastic, bidirectional phenotypic diversification and responsive, directed phenotypic shifts, depending on the growth substrate and the presence of toxin.


Conflict of interest statement

The authors have declared that no competing interests exist.

Figures

Fig 1
Fig 1. Formaldehyde kills M. extorquens at an exponential, concentration-dependent rate.
Formaldehyde was added at the indicated concentrations to liquid cultures of M. extorquens cells growing in minimal medium with methanol, and abundance of viable cells was measured as colony-forming units (CFU) over time. Note that negligible growth is expected to have occurred during the course of this experiment, as the 180-minute duration was less than one generation (~3.5 hrs) for M. extorquens in these conditions. The original data shown in this and all other figures are available in Supporting Information file S1 Data.
Fig 2
Fig 2. Re-growth of M. extorquens after population decline in the presence of formaldehyde is due to a pre-existing sub-population of formaldehyde-tolerant cells.
Stationary-phase cells were inoculated into fresh medium containing methanol and 4 mM formaldehyde. The abundance of viable cells in the two different populations was assessed over time by removing and washing cells, then plating onto both permissive medium (without formaldehyde: "all cells") and selective medium (with 4 mM formaldehyde: "tolerant to 4 mM"). CFU = colony-forming units. Each line represents one biological replicate; error bars show the standard deviation of three replicate platings. Formaldehyde in the liquid medium during the incubation period was measured by a colorimetric assay on subsamples after removing cells by centrifugation.
Fig 3
Fig 3. Cell proliferation assay shows dynamics consistent with the coexistence of both growing and non-growing subpopulations, with no turnover between the two.
Cells were stained with PKH67 fluorescent membrane dye, then allowed to grow in minimal medium with methanol and either 0, 4, or 20 mM formaldehyde. Histograms show per-cell fluorescence of the cells (events measured by flow cytometry) present in 30 μL of culture at each timepoint; colors denote the time of sampling in hours (note that different color scales are used in different panels). Top left: without formaldehyde, all cells underwent doubling, diluting their membrane fluorescence so that the median fluorescence decreased as population increased. Bottom left: at high concentrations of formaldehyde, no cells grew, leaving per-cell fluorescence unchanged. Right: in the presence of 4 mM formaldehyde, most cells did not grow, but a few did; consequently, a small growing population with lower per-cell fluorescence became detectable at 37 hours and continued to increase in abundance thereafter. Results of experiments conducted at other formaldehyde concentrations are shown in S5 Fig. Flow cytometry data are provided in Supporting Information, S4 Data.
Fig 4
Fig 4. Cell damage by formaldehyde results in delayed colony appearance for the majority of cells, but not for the tolerant subpopulation.
Cells from a formaldehyde exposure experiment (liquid MPIPES medium with 4 mM formaldehyde) were sampled at 2- to 4-hour intervals, washed, and plated onto both permissive medium (no formaldehyde, allowing the growth of all cells) and selective medium (4 mM formaldehyde, allowing the growth of only the tolerant subpopulation). A) Images of colonies on plates. Colony size heterogeneity was evident only on permissive medium with cultures exposed to formaldehyde for 16 hours, consistent with a population containing both sensitive cells that formed colonies late due to formaldehyde-induced damage (small colonies) and tolerant cells that formed colonies early (large colonies). All images are shown at the same magnification level; dil = dilution factor prior to plating. B) Relationship between formaldehyde exposure and colony growth characteristics. Shading indicates abundance of colony-forming units in each population (see Fig 2); samples were diluted prior to plating for an average of 500 colonies per plate. Left panel: gray line shows linear regression of appearance time on exposure time for the first 12 hours. Every hour of exposure to formaldehyde led to a ~4.8-hour delay in colony appearance time among sensitive cells. At 16 hours, the population consisted of both damaged and tolerant cells; after 20 hours, all cells were tolerant due to the death of the damaged cells. Right panel: among tolerant cells, formaldehyde exposure had no effect on appearance time. Insets: exposure time affected only the variability among colony growth rates, but not their median.
Fig 5
Fig 5. Gene expression in the formaldehyde-tolerant subpopulation is distinct from that of both unstressed and formaldehyde-stressed sensitive populations.
RNA sequencing was carried out on cells from a 4 mM formaldehyde exposure experiment harvested at 4 hours (sensitive cells losing viability due to formaldehyde toxicity), and 64 hours (selected formaldehyde-tolerant cells in exponential growth in the presence of formaldehyde). Log2 fold change was calculated relative to an unstressed population growing in the absence of formaldehyde. Each circle represents the expression of one gene in the tolerant population (y-axis) versus in the sensitive population (x-axis). Colored circles are genes with >1.0 log2 fold change and padj <0.001 in the tolerant population, as well as genes belonging to the same clusters in the genome (23 genes total, 6 clusters); these are described in Table 1. Error bars indicate standard error for the log fold change estimate. Most genes that were differentially expressed in the tolerant population showed opposite expression patterns in the stressed population.
Fig 6
Fig 6. Time-lapse microscopy reveals binary (i.e., growth or non-growth) phenotypes in response to formaldehyde.
A) Example images: cells were embedded in agar medium with methanol and either 0 mM (top) or 2.5 mM (bottom) formaldehyde and monitored for 9 hours (~3 generations). At 0 mM, 256 cells were observed and all underwent at least one doubling; at 2.5 mM, 546 cells were observed and 11 (1.97%) underwent at least one doubling, in accordance with our predictions for this formaldehyde concentration (see Fig 7). B) Histograms of cell division time (across all generations) and lag time (time between deposition and first cell division, for each microcolony) for cells that grew. No difference was observed in cell division time between the two treatments (p = 0.262, Mann-Whitney Wilcoxon test). However, cells in formaldehyde took approximately 1.25 hours longer to reach the first cell division (p<0.001, Mann-Whitney). C) Scatterplot of individual cell doubling times; each position along the x-axis represents a single microcolony, ordered by mean doubling time (shown in black symbols). Individual doubling time of each cell was strongly predicted by the colony it came from (p = 0.001) but not by formaldehyde treatment (p = 0.323, PERMANOVA).
Fig 7
Fig 7. Subpopulations of formaldehyde-tolerant cells are distributed within a wild-type population with continuous, exponentially-decreasing frequency.
M. extorquens cells not previously exposed to formaldehyde were plated onto methanol agar medium containing a range of formaldehyde concentrations at 1-mM intervals. The frequency of tolerant cells is expressed as the ratio of the colony-forming units (CFU) on formaldehyde medium at the specified concentration to the CFU on formaldehyde-free (0 mM) medium. Error bars denote the standard deviation of replicate experiments from 5 different dates (shown individually in S4 Fig). Detection limit is indicated by the dashed horizontal line.
Fig 8
Fig 8. The distribution of formaldehyde tolerance within an M. extorquens population changes over time depending on growth conditions.
Plots show total abundance (not frequency) of cells tolerant to each level of formaldehyde, as assessed by plating onto selective medium; each colored line represents one timepoint and error bars represent the standard deviation of three plating replicates. For clarity, only one biological replicate is shown; results from other replicates are shown in S6 Fig. Populations were tested for tolerance at up to 10 mM (Selection) or 12 mM (Regrowth), but 0 CFU were detected above 8 mM in either condition. A) Exposure of a naive population to 4 mM formaldehyde results in rapid decline of subpopulations with tolerance levels <4 mM and selective growth of subpopulations with tolerance levels ≥4 mM. B) When the population from A), enriched in tolerant cells, is transferred to medium without formaldehyde, tolerance distribution dynamics depend on the growth substrate provided. If growth occurs on methanol, all subpopulations grow equally well: the enrichment of formaldehyde-tolerant populations is retained for the full 24 hours (~7 generations) of observation. If growth occurs on succinate, subpopulations with high tolerance decline in abundance and those with low tolerance increase: the population reverts to its original naive distribution.
Fig 9
Fig 9. Schematic of processes described by mathematical model of tolerance distribution dynamics.
Cells exist in 1-dimensional phenotype space along a continuum from sensitive to tolerant, with x denoting the maximum concentration of formaldehyde (F) at which a cell can grow. Under normal growth (at rate r), progeny cells carry the same tolerance phenotype as their parents. Exposure to formaldehyde results in the death of low-tolerance (x<F) phenotypes at a rate described by H(x, F). In the process of diffusion, cells and their progeny shift to adjacent tolerant states according to the diffusion constant D, resulting in the broadening of the population's tolerance distribution. In advection, cells and their progeny move in a single direction in tolerance space at rate ν, resulting in an overall shift in the population's distribution toward either lower or higher average tolerance.
Fig 10
Fig 10. Mathematical modeling reproduces growth, death, and phenotype transition dynamics of M. extorquens population under multiple conditions.
A) and B) Heat maps showing model simulations of population dynamics. Model parameters as given in Table 2. Note that model results are continuous in phenotype space, and non-cumulative (the abundance at concentration x shows only the number of cells for which that is the maximum concentration tolerable, not the number of all cells that can grow at that concentration; see Methods for details). C) and D) Comparison of model results (lines) and experimental data (points). Experimental data are averages of 3 biological replicates; model results have been binned at 1- or 2-mM intervals, and summed to form cumulative distributions, to facilitate comparison. A and C) 4 mM formaldehyde exposure experiment, resulting in selection of cells with >4 mM tolerance. B and D) Formaldehyde-free regrowth experiment, in which the selected high-tolerance population is transferred to medium without formaldehyde and either methanol or succinate as the carbon substrate, resulting in different shifts in phenotype distribution.

References

    1. Harms A, Fino C, Sørensen MA, Semsey S, Gerdes K. Prophages and growth dynamics confound experimental results with antibiotic-tolerant persister cells. mBio. 2017;8: e01964–17. 10.1128/mBio.01964-17 - DOI - PMC - PubMed
    1. Shaffer SM, Dunagin MC, Torborg SR, Torre EA, Emert B, Krepler C, et al. Rare cell variability and drug-induced reprogramming as a mode of cancer drug resistance. Nature. 2017;546: 431–435. 10.1038/nature22794 - DOI - PMC - PubMed
    1. Lorenzi T, Chisholm RH, Desvillettes L, Hughes BD. Dissecting the dynamics of epigenetic changes in phenotype-structured populations exposed to fluctuating environments. J Theor Biol. 2015;386: 166–176. 10.1016/j.jtbi.2015.08.031 - DOI - PubMed
    1. Vasdekis AE, Silverman AM, Stephanopoulos G. Origins of cell-to-cell bioprocessing diversity and implications of the extracellular environment revealed at the single-cell level. Sci Rep. 2015;5: 17689 10.1038/srep17689 - DOI - PMC - PubMed
    1. Elowitz MB, Levine AJ, Siggia ED, Swain PS. Stochastic gene expression in a single cell. Science. 2002;297: 1183–1186. 10.1126/science.1070919 - DOI - PubMed

Publication types

MeSH terms