. 2019 Nov 11;15(11):e1007426.
doi: 10.1371/journal.pcbi.1007426. eCollection 2019 Nov.

Adaptation in structured populations and fuzzy boundaries between hard and soft sweeps

Affiliations

Adaptation in structured populations and fuzzy boundaries between hard and soft sweeps

Yichen Zheng et al. PLoS Comput Biol. .

Abstract

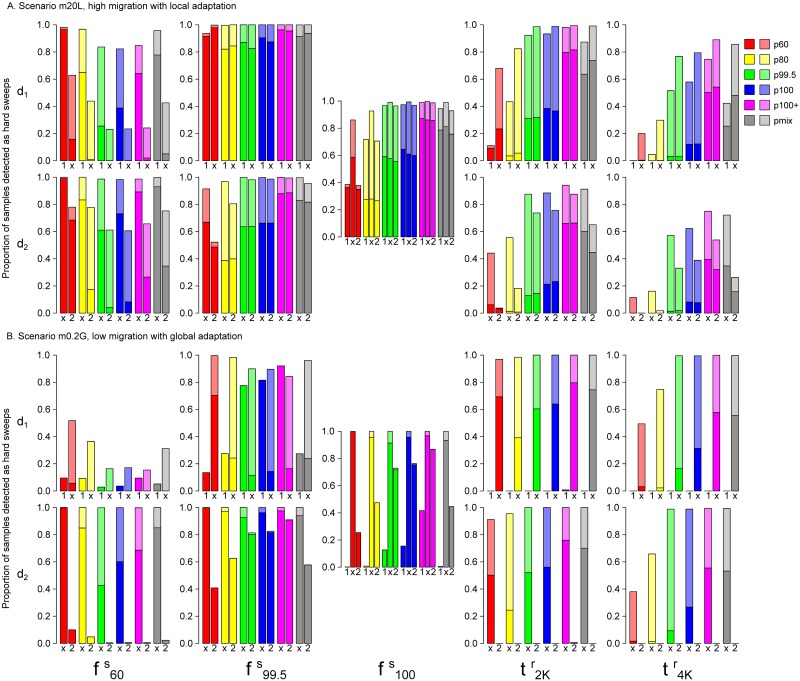
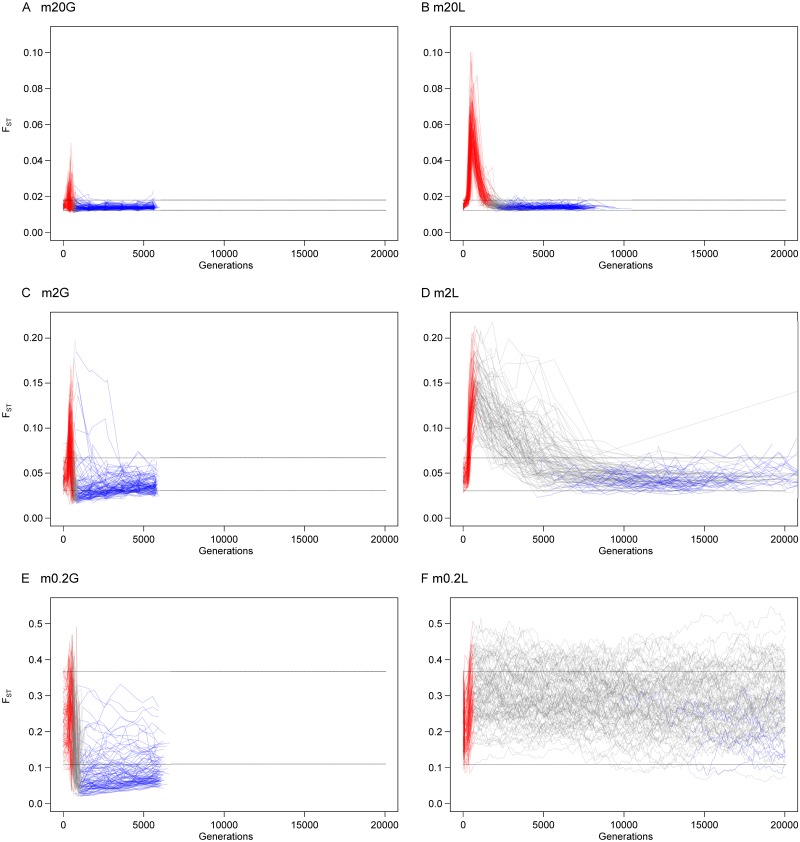
Selective sweeps, the genetic footprint of positive selection, have been extensively studied in the past decades, with dozens of methods developed to identify swept regions. However, these methods suffer from both false positive and false negative reports, and the candidates identified with different methods are often inconsistent with each other. We propose that a biological cause of this problem can be population subdivision, and a technical cause can be incomplete, or inaccurate, modeling of the dynamic process associated with sweeps. Here we used simulations to show how these effects interact and potentially cause bias. In particular, we show that sweeps maybe misclassified as either hard or soft, when the true time stage of a sweep and that implied, or pre-supposed, by the model do not match. We call this "temporal misclassification". Similarly, "spatial misclassification (softening)" can occur when hard sweeps, which are imported by migration into a new subpopulation, are falsely identified as soft. This can easily happen in case of local adaptation, i.e. when the sweeping allele is not under positive selection in the new subpopulation, and the underlying model assumes panmixis instead of substructure. The claim that most sweeps in the evolutionary history of humans were soft, may have to be reconsidered in the light of these findings.


Conflict of interest statement

The authors have declared that no competing interests exist.

Figures

Fig 1
Fig 1. Schematic of evolutionary scenarios in this study.
A: Possible demographies for single-site simulation; two-deme and three possibilities for three-deme. Different shades indicate that selection strength can be different between demes. Migration rates are identical between deme pairs and range from 0.02 to 200. B: Five scenarios explored in the full-locus simulation. Light red indicating selection in that deme and white indicates neutrality. Only m20L and m0.2G were analyzed for mixed-deme samples from R simulations (second row). Only m0G and m20L were simulated with SLiM (third row), of which only the latter were analyzed for mixed-deme samples from SLiM simulations (fourth row). Other scenarios listed in Table 2 were used for FST analysis only.
Fig 2
Fig 2. Single-site simulation: Migration rate and time.
A: The time taken for an adaptive allele from the beginning (mutation event) to reach a frequency of 99.5%. B: The duration of selection phase, defined as the time between the adaptive allele reaching 5% and 99.5%.
Fig 3
Fig 3. Single-site simulation: Through a middle-deme.
A, C: The time taken for an adaptive allele from the initial mutation event to reach a frequency of 99.5% in the destination deme d2. B, D: The duration of selection phase, defined as the time between the adaptive allele reaching 5% and 99.5%, in the destination deme d2. The allele has no fitness effect (A, B), or a very weak one (C, D) in the middle deme d1. E: The average joint trajectory of the adaptive allele frequency in d1 and d2, where the allele is neutral (solid lines) or very weakly selected (s = 0.005, dash lines) in d1. In the left-top half, the frequency is lower in d1. Different colors indicate different migration rates.
Fig 4
Fig 4. Full-locus simulation: The detection rate of various methods in a panmictic scenario.
The proportion of samples detected as selective sweeps by various methods, under the scenario m0G. The vertical line indicates time of 100% fixation. A. Power of seven summary statistics; dashed lines indicate haplotype-based methods. B. Proportion detected by six EvolBoosting predictors correctly as hard sweeps. C. Proportion detected by six EvolBoosting predictors incorrectly as soft sweeps. See S3 Fig for a zoomed-in version for early stages.
Fig 5
Fig 5. Full-locus simulation: Cross-testing EvolBoosting predictors in simulated panmictic populations.
A: False positive of neutral data, where only the segment 0–200kb (circles) is used as training sets. Similarity among the three segments indicate absence of over-fitting. B-D: The proportion of samples detected as soft (lighter color) or hard (darker color) selective sweeps, using each other’s training sets for testing. B: Cross-testing using hard sweep samples of different stages, using the region within 100kb from selection site. C: Cross-testing using soft sweep samples of different stages, using the region within 100kb from selection site. D: Cross-testing using hard sweep samples of different stages, but using the region 100–300kb away from selection site. The down-arrow indicates where the tested dataset matches the stage of predictor.
Fig 6
Fig 6. Full-locus simulation: The detection rate of various methods in global adaptation scenarios in the native deme.
The proportion of samples detected as selective sweeps by various methods, under the scenarios: A-C. m20G, D-F. m2G, G-I. m0.2G, in d1 where the adaptive allele arises. The vertical line indicates time of 100% fixation. A,D,G. Power of seven summary statistics; dashed lines indicate haplotype-based methods. B,E,H. Proportion detected by six EvolBoosting predictors correctly as hard sweeps. C,F,I. Proportion detected by six EvolBoosting predictors incorrectly as soft sweeps. See S3 Fig for a zoomed-in version for early stages of m0.2G.
Fig 7
Fig 7. Full-locus simulation: The detection rate of various methods in a local adaptation scenario.
The proportion of samples detected as selective sweeps by various methods, under the scenario m20L. The vertical line indicates time of 100% fixation. A. Power of seven summary statistics in d1; dashed lines indicate haplotype-based methods. B. Proportion detected by six EvolBoosting predictors correctly as hard sweeps in d1. C. Proportion detected by six EvolBoosting predictors incorrectly as soft sweeps in d1. D. False positive rate of seven summary statistics in d2. E. Proportion detected by six EvolBoosting predictors incorrectly as hard sweeps in d2. F. Proportion detected by six EvolBoosting predictors incorrectly as soft sweeps in d2. See S3 Fig for a zoomed-in version for early stages.
Fig 8
Fig 8. Full-locus simulation: Comparing summary statistic detection rate of sweeps between deme-specific samples and mixed samples.
The proportion of samples detected as sweeps from d1, mixed samples and d2 (noted below the bars as “1”, “x” and “2”) in various time stages, for scenarios A: m20L, B: m0.2G. Different hues indicate different methods, and the shades represent d1, mixed and d2 from dark to light. f100s (global fixation) is shared by both demes, thus the graph in the middle contains results from d1, mixed and d2. The other four time points are deme-specific, thus we must compare only one deme with mixed data.
Fig 9
Fig 9. Full-locus simulation: Comparing evolBoosting detection rate of sweeps between deme-specific samples and mixed samples.
The proportion of samples detected as hard (darker shade) or soft sweeps (lighter shade) by six EvolBoosting predictors, from d1, mixed samples and d2 (noted below the bars as “1”, “x” and “2”). Scenarios are A: m20L, B: m0.2G. f100s (global fixation) is shared by both demes, thus the graph in the middle contains results from d1, mixed and d2. The other four time points are deme-specific, thus we must compare only one deme with mixed data.
Fig 10
Fig 10. Full-locus simulation: FST.
The change of between-deme FST during a selective sweep and recovery. Red indicates the period before the adaptive allele reaches 99.5% in d1, blue indicates the period after global fixation, and gray for the period in-between. Each line is one replicate population. The scenarios are: A. m20G; B. m20L; C. m2G; D. m2L; E. m0.2G; F. m0.2L. For m0.2L the time points are fixed number of generations (every 100 generations) instead of based on allele frequency. Horizontal dash lines denote the 95% range of the neutral baseline FST, i.e. the value at 0 generations.

References

    1. Maynard-Smith J, Haigh J. The hitch-hiking effect of a favourable gene. Genetics Research. 1974;23(1):23–35. 10.1017/S0016672300014634 - DOI - PubMed
    1. Kaplan NL, Hudson R, Langley C. The “hitchhiking effect” revisited. Genetics. 1989;123(4):887–899. - PMC - PubMed
    1. Charlesworth B. New genes sweep clean. Nature. 1992;356(6369):475 10.1038/356475a0 - DOI - PubMed
    1. Nielsen R. Molecular signatures of natural selection. Annu Rev Genet. 2005;39:197–218. 10.1146/annurev.genet.39.073003.112420 - DOI - PubMed
    1. Andolfatto P. Adaptive hitchhiking effects on genome variability. Current opinion in genetics & development. 2001;11(6):635–641. 10.1016/S0959-437X(00)00246-X - DOI - PubMed

Publication types