. 2020 Jan;29(1):277-297.
doi: 10.1002/pro.3783. Epub 2019 Nov 28.

The Dundee Resource for Sequence Analysis and Structure Prediction

Affiliations

The Dundee Resource for Sequence Analysis and Structure Prediction

Stuart A MacGowan et al. Protein Sci. 2020 Jan.

Abstract

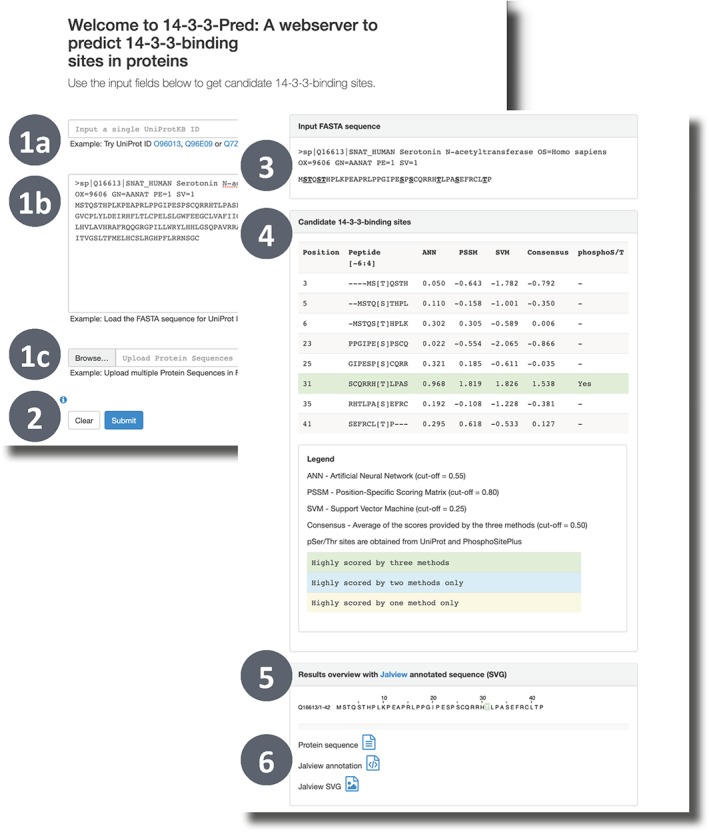
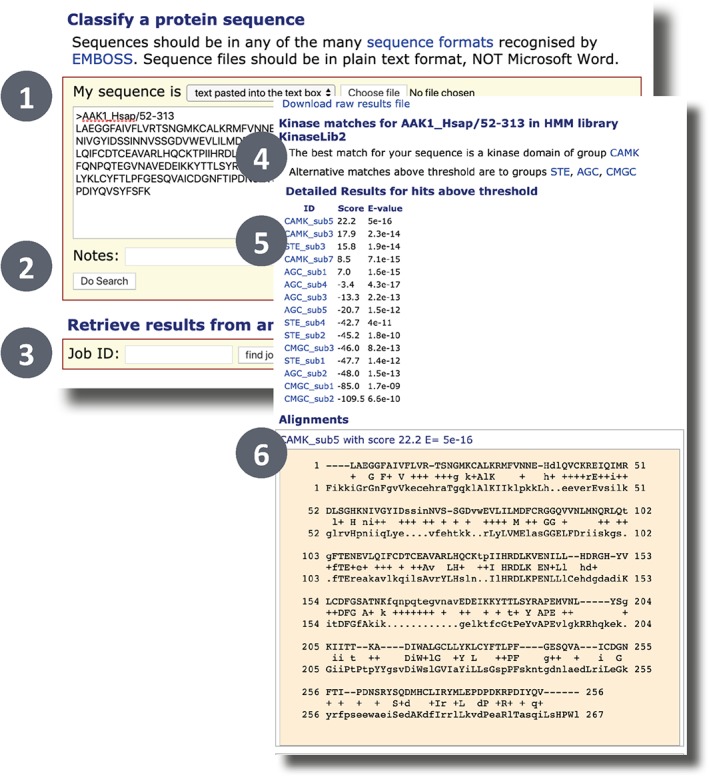
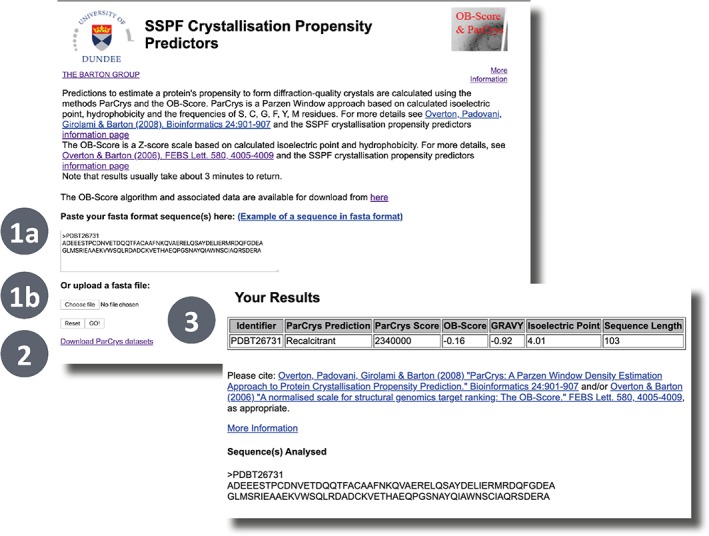
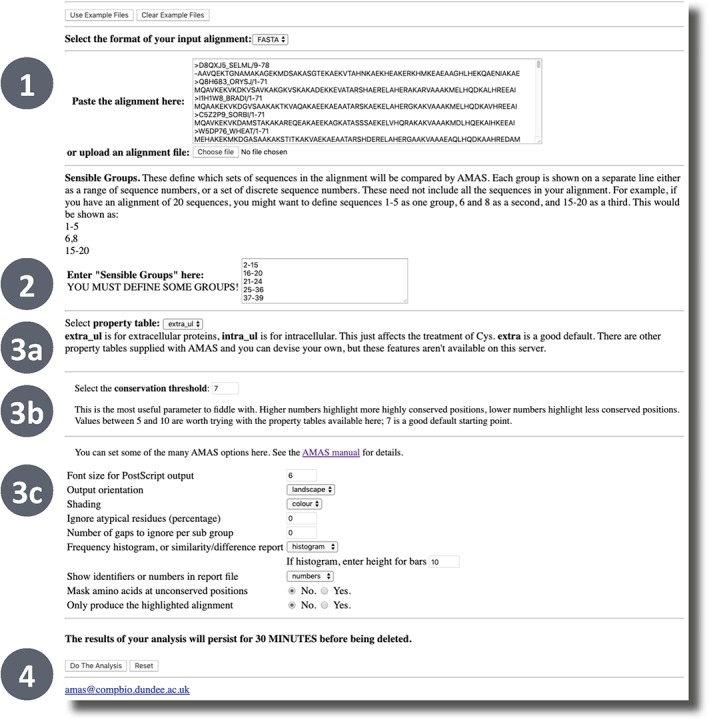
The Dundee Resource for Sequence Analysis and Structure Prediction (DRSASP; http://www.compbio.dundee.ac.uk/drsasp.html) is a collection of web services provided by the Barton Group at the University of Dundee. DRSASP's flagship services are the JPred4 webserver for secondary structure and solvent accessibility prediction and the JABAWS 2.2 webserver for multiple sequence alignment, disorder prediction, amino acid conservation calculations, and specificity-determining site prediction. DRSASP resources are available through conventional web interfaces and APIs but are also integrated into the Jalview sequence analysis workbench, which enables the composition of multitool interactive workflows. Other existing Barton Group tools are being brought under the banner of DRSASP, including NoD (Nucleolar localization sequence detector) and 14-3-3-Pred. New resources are being developed that enable the analysis of population genetic data in evolutionary and 3D structural contexts. Existing resources are actively developed to exploit new technologies and maintain parity with evolving web standards. DRSASP provides substantial computational resources for public use, and since 2016 DRSASP services have completed over 1.5 million jobs.


Figures

Figure 1
Figure 1
The Dundee Resource for Sequence Analysis and Structure Prediction
Figure 2
Figure 2
Running MAFFT18 L‐INS‐i alignment with Jalview's1 default JABAWS10 configuration. (1) Web Service → Alignment → Run Mafft with preset → L‐INS‐i. If custom parameters are desired they can be set in the dialog available through “Edit settings and run …” (2) A new window reports the job arguments and its progress. (3) The resulting alignment opens in a new window (n.b. the results MSA can be reopened with the “New Window” in the progress window)
Figure 3
Figure 3
Illustration of a JPred42 secondary structure prediction displayed in Jalview1 (left) and UCSF Chimera40 (right). Below the query sequence, JPred provides several annotation tracks for visualization in Jalview. These are the Lupas39 Coil predictions with varying window sizes (“‐“ = no coil; “c” = likely coil; “C” = coil); the final JNet prediction (red, helix; green, strand) followed by a confidence score for the prediction (0–9; least to highest confidence). These are followed by separate predictions where JNet is given only the profile HMM or PSSM and the JNETJURY track that indicates positions where these predictions differ (indicated by “*”). Finally, burial predictions are represented by a histogram of values ranging 0–3, representing no burial and burial at 25, 5, and 0% thresholds, respectively. The query sequence and structure illustration are derived from PDB ID: 3AXM41
Figure 4
Figure 4
Comparison of evolutionary conservation scores. An excerpt of the Pfam31 WD40 repeat family (PF00400) is displayed together with Jalview1 annotation tracks representing five different conservation metrics (the scores were calculated for the first 89 SwissProt sequences in this Pfam, only the first 17 are shown). The Conservation and Consensus tracks are calculated by Jalview whilst the Valdar, Shenkin, and Zvelebil tracks are calculated with AACon via JABAWS called from the Jalview webservices menu
Figure 5
Figure 5
14‐3‐3‐Pred3 submission page (back). The website presents a form where you can enter either a UniProt accession (1a), a FASTA sequence (1b), or upload a set of sequences in a FASTA file (1c). The prediction is started by clicking “Submit” (2). 14‐3‐3‐Pred results page (front). The results indicate the query sequence with S/T sites highlighted (3); a table showing the query motifs, the prediction scores, and whether the site is known to be phosphorylated (4); a sequence view of the predictions (5) and download links including Jalview feature file format (6)
Figure 6
Figure 6
Illustration of Serotonin N‐acetyltransferase (right; white) in complex with 14‐3‐3 zeta (left; tan) showing the interaction of pThr31 with 14‐3‐3 zeta. The 14‐3‐3‐Pred predicted 14‐3‐3 targets pThr 31 and Ser 118 in Serotonin N‐acetyltransferase are indicated with black arrows. Figure adapted from PDB ID: 1ib158 chains A and E, with UCSF Chimera and Jalview
Figure 7
Figure 7
NoD9 input form (back). The user can input either a protein accession to query a precomputed set of results (1) or paste a FASTA sequence (2a) to run an ab initio prediction. If a sequence prediction is requested this can be done with or without using a JPred prediction as a feature (2b; n.b. NoD uses JPred3). The prediction is started by clicking “Submit” (3). NOD output form (front). Any predicted nucleolar localization sequences are shown both in isolation (4) and in context of the query sequence (5) and a line plot indicates the average score of 20 residue segments (6; see online help for more info)
Figure 8
Figure 8
The Kinomer5 search input (back) and output forms (front). The user can paste a FASTA sequence (1) and start the classification by clicking “Submit” (2) or retrieve the results from a previously submitted job using the Kinomer job ID (3). If there are any hits to the Kinomer profile HMM library above Kinomer's thresholds, then the best matching kinase group (4) and alternative matches are reported (5). Alignments for each hit are shown below (6) and can be downloaded from the top of the page
Figure 9
Figure 9
XANNpred8 windowed predictions for XANNpred‐PDB (left) and XANNpred‐SG (right). The prediction threshold is indicated by the dashed line (0.517 for XANNpred‐PDB; 0.418 for XANNpred‐SG). The windows are 61 residues long and so the first window is centered at residue 31. A relaxed interpretation considers high‐scoring regions as those residues that are contained within a high‐scoring window (i.e., ±31 residues of the window center). A conservative interpretation is restricted to where the window centers are above the prediction threshold. XANNpred provides these figures as attachments in the results email
Figure 10
Figure 10
XTal input form for OB‐Score6 and ParCrys.7 Xtal output form. Users can input a sequence or multiple sequences by pasting FASTA format into the textbox (1a) or uploading a FASTA file (1b). The prediction is then run by clicking the “GO!” button. A link to download the ParCrys datasets is provided at the bottom of the page. Once the calculation is complete, the results page will load and display a table listing the OB‐Score and the ParCrys score and prediction for each submitted sequence alongside the GRAVY, pI, and the sequence length
Figure 11
Figure 11
The AMAS14 input form. AMAS accepts FASTA, AMPS or Pfam formatted alignments via the textbox or file upload (1). Groups are defined via a textbox with one line per group and sequences referred to by their row index (2; e.g., “1–5” on a line defines a group of the first five sequences). The job can then be started with default parameters by clicking the “Do The Analysis” button (4) or advanced options may be set. These include the property table (3a), the conservation threshold (3b) and other formatting and analysis options (3c)
Figure 12
Figure 12
AMAS14 results visualization of an illustrative analysis upon Pfam PF03760. The alignment illustrates within group and between group conservation. Within group conservation is illustrated by block shading within the subgroups: blue indicates subgroup identity whilst green indicates property conservation. Additionally, red shading indicates total conservation across all groups. The histogram displays the similarities (orange) and differences scores (violet). The visualization is generated with Alscript.42 AMAS, Analysis of Multiply Aligned Sequences
Figure 13
Figure 13
Example output from VarAlign and ProIntVar analysis32 of SH2 domains from Pfam31 PF00017 visualized with Jalvew1 and UCSF Chimera.40 In the alignment, nine of the most missense depleted SH2 domains are shown. The locations of missense variants from the gnomAD71 dataset are shown as semitransparent red features. The locations of residue–ligand interactions by ligands that bind in the SH2 canonical binding site are shown in semitransparent green. In these proteins, no missense variants occur at these positions (i.e., these features do not overlap). Four annotation tracks are shown, from top to bottom: Jalview calculated consensus; whether positions are classified as unconserved‐missense depleted (UMD), unconserved‐missense enriched (UME), conserved‐missense enriched (CME), or conserved‐missense depleted (CMD).32 The structure shows the interaction between the SH2 domain of phosphatidylinositol 3‐kinase regulatory subunit alpha and the platelet‐derived growth factor receptor beta phosphotyrosyl peptide in PDB ID: 2IUI. The locations of missense variants from the gnomAD dataset are shown in red. The locations of residue–ligand interactions by ligands that bind in the SH2 canonical binding site—in any structure that maps to this protein—are shown in green

References

    1. Waterhouse AM, Procter JB, Martin DM, Clamp M, Barton GJ. Jalview version 2—A multiple sequence alignment editor and analysis workbench. Bioinformatics. 2009;25:1189–1191. - PMC - PubMed
    1. Drozdetskiy A, Cole C, Procter J, Barton GJ. JPred4: A protein secondary structure prediction server. Nucleic Acids Res. 2015;43:W389–W394. - PMC - PubMed
    1. Madeira F, Tinti M, Murugesan G, et al. 14‐3‐3‐Pred: Improved methods to predict 14‐3‐3‐binding phosphopeptides. Bioinformatics. 2015;31:2276–2283. - PMC - PubMed
    1. Manning JR, Jefferson ER, Barton GJ. The contrasting properties of conservation and correlated phylogeny in protein functional residue prediction. BMC Bioinformatics. 2008;9:51. - PMC - PubMed
    1. Martin DM, Miranda‐Saavedra D, Barton GJ. Kinomer v. 1.0: A database of systematically classified eukaryotic protein kinases. Nucleic Acids Res. 2009;37:D244–D250. - PMC - PubMed

Publication types

LinkOut - more resources