. 2020 Mar 14;30(3):1931-1945.
doi: 10.1093/cercor/bhz214.

Posterior Alpha and Gamma Oscillations Index Divergent and Superadditive Effects of Cognitive Interference

Affiliations

Posterior Alpha and Gamma Oscillations Index Divergent and Superadditive Effects of Cognitive Interference

Alex I Wiesman et al. Cereb Cortex. .

Abstract

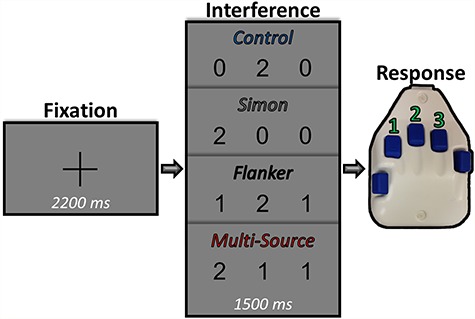
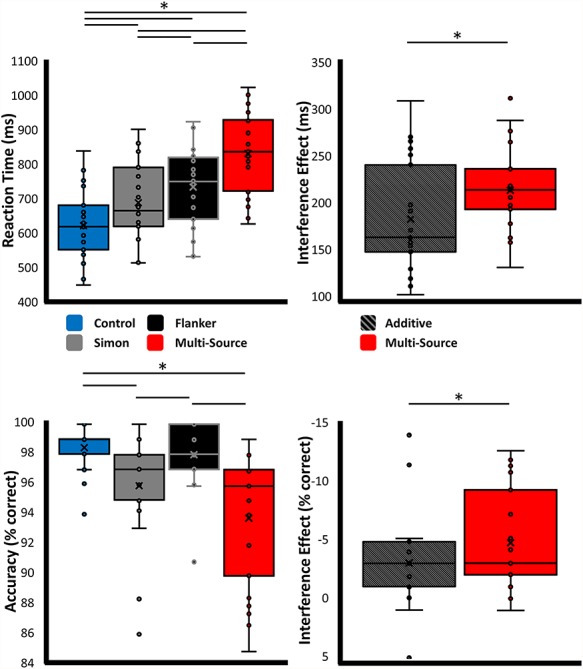
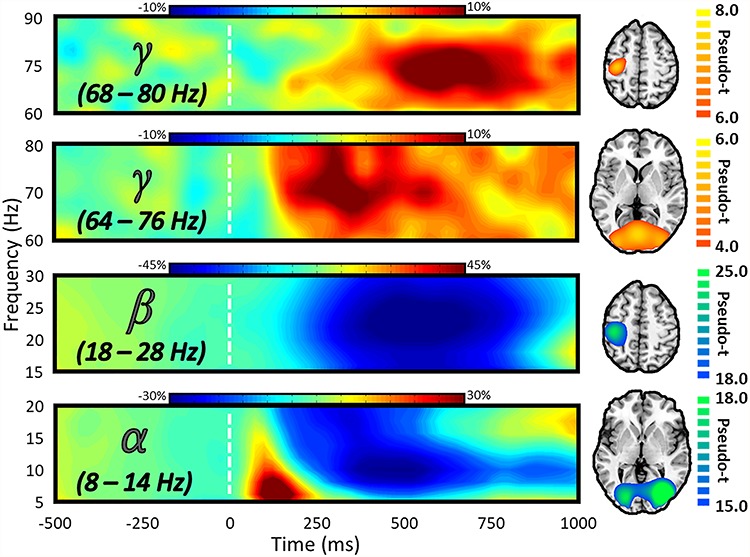
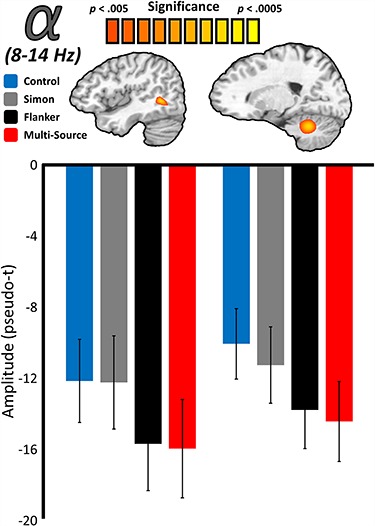
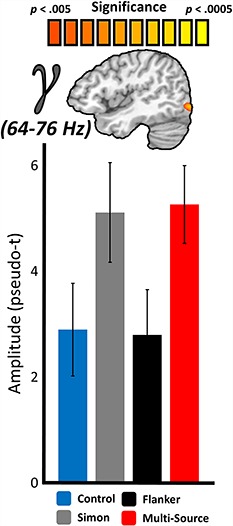
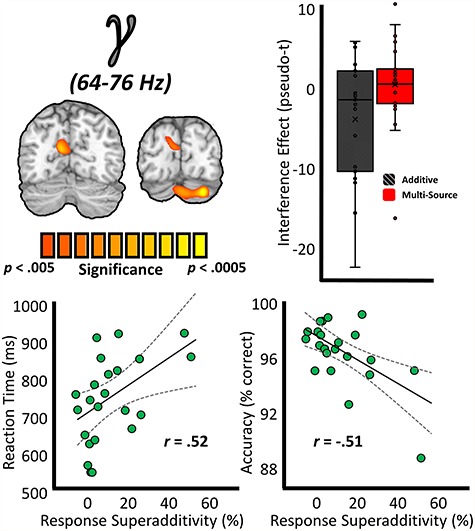
Conflicts at various stages of cognition can cause interference effects on behavior. Two well-studied forms of cognitive interference are stimulus-stimulus (e.g., Flanker), where the conflict arises from incongruence between the task-relevant stimulus and simultaneously presented irrelevant stimulus information, and stimulus-response (e.g., Simon), where interference is the result of an incompatibility between the spatial location of the task-relevant stimulus and a prepotent motor mapping of the expected response. Despite substantial interest in the neural and behavioral underpinnings of cognitive interference, it remains uncertain how differing sources of cognitive conflict might interact, and the spectrally specific neural dynamics that index this phenomenon are poorly understood. Herein, we used an adapted version of the multisource interference task and magnetoencephalography to investigate the spectral, temporal, and spatial dynamics of conflict processing in healthy adults (N = 23). We found a double-dissociation such that, in isolation, stimulus-stimulus interference was indexed by alpha (8-14 Hz), but not gamma-frequency (64-76 Hz) oscillations in the lateral occipital regions, while stimulus-response interference was indexed by gamma oscillations in nearby cortices, but not by alpha oscillations. Surprisingly, we also observed a superadditive effect of simultaneously presented interference types (multisource) on task performance and gamma oscillations in superior parietal cortex.

Keywords: double dissociation; magnetoencephalography; multisource interference task; neural oscillations; superadditivity.


Figures

Figure 1
Figure 1
Experimental paradigm. Each trial began with a central fixation presented for a randomly varied interstimulus interval of 2000–2400 ms. After this, the fixation was replaced by a vertically centered horizontal row of three equally spaced integers between 0 and 3. The presentation of the integer stimuli lasted for 1500 ms. Two of these integers were always identical (task irrelevant) and the third was different (task relevant). Prior to beginning the experiment, participants were given a five-finger button pad and instructed that the index, middle, and ring finger locations represented the integers 1, 2, and 3, respectively. Participants were then instructed that on each trial they would be presented with a horizontal row of three integers, and that the objective was to indicate the “odd-number-out” by pressing the button corresponding to its numerical identity (and not its spatial location). Using these stimuli, four interference conditions were possible: (1) control (no interference), (2) Simon (stimulus–response interference), (3) Flanker (stimulus–stimulus interference), and (4) multisource.
Figure 2
Figure 2
Behavioral results. Results from the behavioral analyses, with data for the main effect of interference condition presented on the left, and results from the superadditivity analyses on the right. Plots display the individual data points, along with the median (horizontal line), mean (x), first and third quartile (box), and local minima and maxima (whiskers). *P < 0.01, corrected.
Figure 3
Figure 3
Spectral, temporal, and spatial definitions of neural responses to the MSIT task. The MEG sensor spectrograms (left) display the time–frequency representations of neural responses identified by cluster-based permutation analysis (see section Methods). Time (in ms) is denoted on the x-axis and frequency (in Hz) is denoted on the y-axis, and the dashed white line at 0 ms indicates the onset of the integer stimuli. The color scale bar for percent change from baseline is displayed above each plot. Each spectrogram represents group-averaged data from one gradiometer sensor that was representative of the neural responses in sensors over either occipito-parietal (second and fourth from the top) or somato-motor (first and third from the top) regions. On the far right is the source-imaged representation of each response, with the color scale bar to the right denoting response amplitude in pseudo-t units.
Figure 4
Figure 4
Main effects of interference on the posterior alpha response. Source-level images (top) reflect the significant results of whole-brain RM–ANOVAs testing for a main effect of interference condition on visual neural responses in the alpha-frequency (8–14 Hz) band, with the color scale bar at the top denoting voxel-wise significance. Below each image are the average response amplitude values (in pseudo-t) for each interference condition, with error bars denoting standard error of the mean (SEM). For both the right lateral occipital and right cerebellar peak voxels, responses to Simon interference did not differ from the control condition, and responses to Flanker interference did not differ from multisource interference. Responses to Simon and Flanker interference also significantly differed at both locations.
Figure 5
Figure 5
Main effects of interference on the posterior gamma response. Similar to Figure 3, the source-level image (top) represents the significant results of whole-brain RM–ANOVAs testing for a main effect of interference condition on neural responses in the gamma-frequency range (64–76 Hz), with the color scale bar at top denoting voxel-wise significance. Below the image are the average response amplitude values (in pseudo-t) for each interference condition, with error bars denoting SEM. For the right lateral occipital peak voxel, responses to Flanker interference did not differ from the control condition, and responses to Simon interference did not differ from multisource interference. Responses to Simon and Flanker interference also significantly differed at this location, as did responses to Flanker and multisource interference.
Figure 6
Figure 6
Superadditivity effects on the gamma response and relationships to behavior. (Top left) Source-level images on the left represent whole-brain paired-samples t-tests between the additive model (Flanker + Simon) and multisource model in the gamma band, with the color scale bar below denoting voxel-wise significance. (Top right) Box-and-whisker plot data demonstrating the superadditivity effect on gamma activity at the left superior parietal peak voxel. (Bottom) To examine the relationship between these neural indices and behavior, response superadditivity ([multisource/additive] × 100) values were computed for the superadditivity peaks, and these values were correlated with metrics of task performance. These relationships are displayed at the bottom, with RT (in ms) on the y-axis of the bottom left plot and accuracy (in % correct) denoted on the y-axis of the far right plot. For both plots, response superadditivity (in %) is denoted on the x-axis, and lines of best-fit are overlaid on the plot along with the correlation coefficient for each respective relationship.

References

    1. Andersen P, Andersson SA. 1968. Physiological basis of the alpha rhythm. New York: Plenum Publishing Corporation.
    1. Aron AR, Robbins TW, Poldrack RA. 2004. Inhibition and the right inferior frontal cortex. Trends Cogn Sci. 8(4):170–177. - PubMed
    1. Aron AR, Robbins TW, Poldrack RA. 2014. Inhibition and the right inferior frontal cortex: one decade on. Trends Cogn Sci. 18(4):177–185. - PubMed
    1. Baayen RH, Milin P. 2010. Analyzing reaction times. Int J Psychol Res. 3(2):12–28.
    1. Baddeley AD, Baddeley HA, Bucks RS, Wilcock GK. 2001. Attentional control in alzheimer's disease. Brain. 124(Pt 8):1492–1508. - PubMed

Publication types