. 2020 Feb;158(3):494-505.e6.
doi: 10.1053/j.gastro.2019.10.039. Epub 2019 Nov 9.

Circulating Tumor DNA Analysis for Detection of Minimal Residual Disease After Chemoradiotherapy for Localized Esophageal Cancer

Affiliations

Circulating Tumor DNA Analysis for Detection of Minimal Residual Disease After Chemoradiotherapy for Localized Esophageal Cancer

Tej D Azad et al. Gastroenterology. 2020 Feb.

Abstract

Background & aims: Biomarkers are needed to risk stratify after chemoradiotherapy for localized esophageal cancer. These could improve identification of patients at risk for cancer progression and selection of additional therapy.

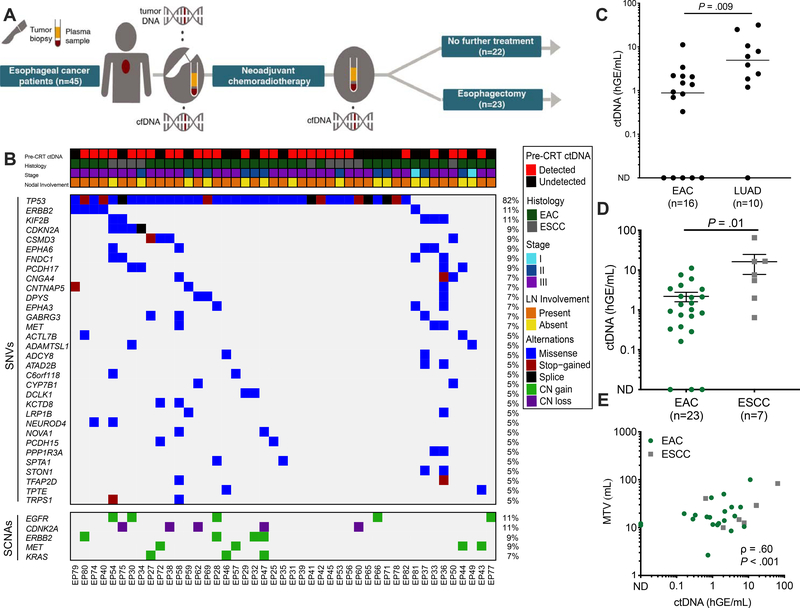
Methods: We performed deep sequencing (CAncer Personalized Profiling by deep Sequencing, [CAPP-Seq]) analyses of plasma cell-free DNA collected from 45 patients before and after chemoradiotherapy for esophageal cancer, as well as DNA from leukocytes and fixed esophageal tumor biopsy samples collected during esophagogastroduodenoscopy. Patients were treated from May 2010 through October 2015; 23 patients subsequently underwent esophagectomy, and 22 did not undergo surgery. We also sequenced DNA from blood samples from 40 healthy control individuals. We analyzed 802 regions of 607 genes for single-nucleotide variants previously associated with esophageal adenocarcinoma or squamous cell carcinoma. Patients underwent imaging analyses 6-8 weeks after chemoradiotherapy and were followed for 5 years. Our primary aim was to determine whether detection of circulating tumor DNA (ctDNA) after chemoradiotherapy is associated with risk of tumor progression (growth of local, regional, or distant tumors, detected by imaging or biopsy).

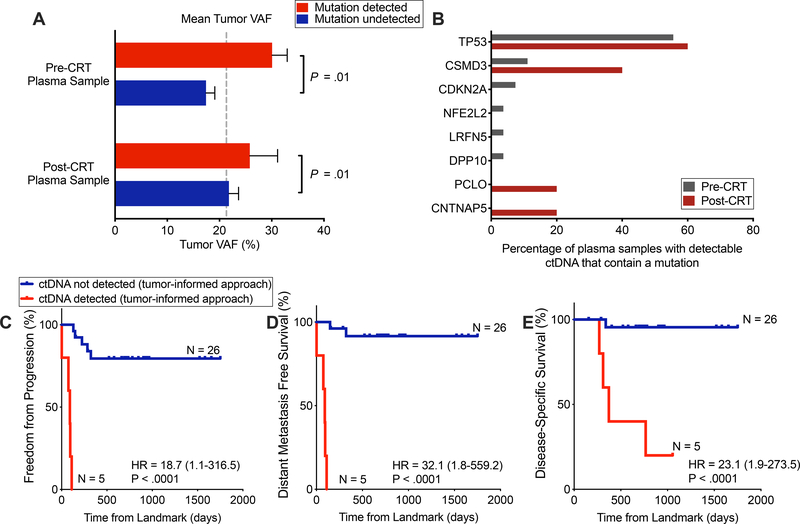
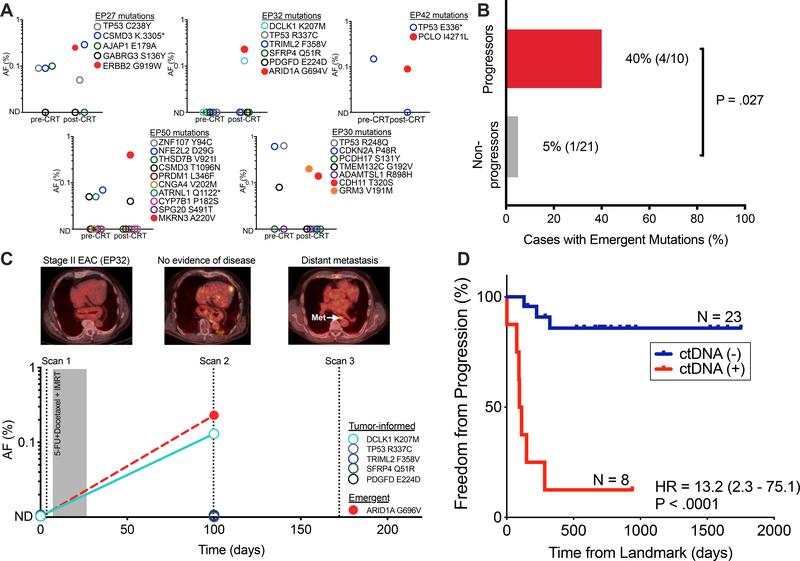
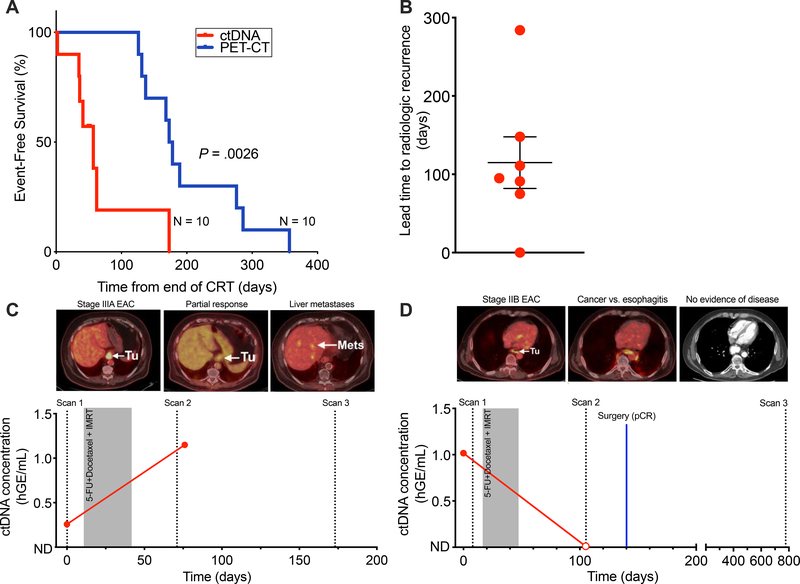
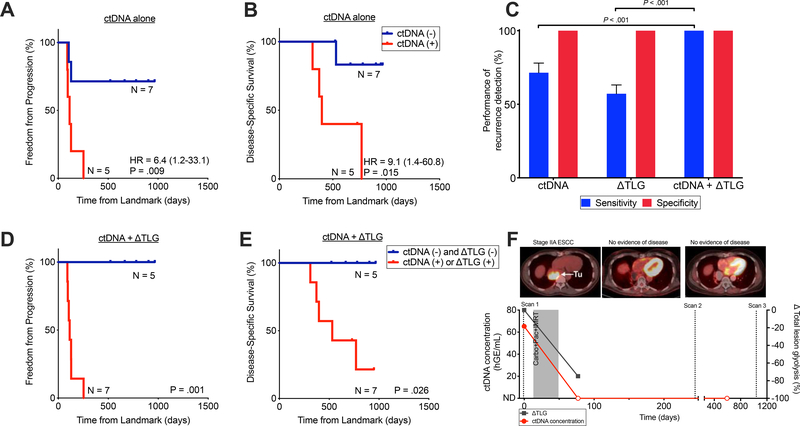
Results: The median proportion of tumor-derived DNA in total cell-free DNA before treatment was 0.07%, indicating that ultrasensitive assays are needed for quantification and analysis of ctDNA from localized esophageal tumors. Detection of ctDNA after chemoradiotherapy was associated with tumor progression (hazard ratio, 18.7; P < .0001), formation of distant metastases (hazard ratio, 32.1; P < .0001), and shorter disease-specific survival times (hazard ratio, 23.1; P < .0001). A higher proportion of patients with tumor progression had new mutations detected in plasma samples collected after chemoradiotherapy than patients without progression (P = .03). Detection of ctDNA after chemoradiotherapy preceded radiographic evidence of tumor progression by an average of 2.8 months. Among patients who received chemoradiotherapy without surgery, combined ctDNA and metabolic imaging analysis predicted progression in 100% of patients with tumor progression, compared with 71% for only ctDNA detection and 57% for only metabolic imaging analysis (P < .001 for comparison of either technique to combined analysis).

Conclusions: In an analysis of cell-free DNA in blood samples from patients who underwent chemoradiotherapy for esophageal cancer, detection of ctDNA was associated with tumor progression, metastasis, and disease-specific survival. Analysis of ctDNA might be used to identify patients at highest risk for tumor progression.

Keywords: Chemoradiotherapy; Genetics; Polymorphism; SNP.


Figures

Figure 1.
Figure 1.. Pre-CRT assessment of ctDNA in patients with locally advanced ESCA.
(A) Study overview of forty-five patients with EGD-proven locally advanced ESCA enrolled in the study. Plasma samples were collected before and after chemoradiotherapy (CRT). Following CRT, patients either underwent esophagectomy (n=23) or no further treatment (n=22). (B) Clinical characteristics and tumor genotyping results. Pre-CRT ctDNA detection status and clinical characteristics, where each column is a patient and each row is a parameter (e.g. histology). Similarly, the associated co-mutation plot depicts patient-level mutational profiles of 45 tumors from patients with esophageal cancer genotyped by our ESCA-specific NGS panel. Genes mutated in at least 5% of the patients in our cohort are depicted. The fraction of tumors with mutations in each gene is denoted on the left. (C) Comparison of absolute ctDNA concentration between Stage III esophageal adenocarcinoma (EAC, n=16) and Stage III lung adenocarcinoma (LUAD, n=10). P value calculated by the Mann-Whitney test. (D) Pre-treatment ctDNA concentration in esophageal adenocarcinoma (EAC, n= 23) and esophageal squamous cell carcinoma (ESCC, n=7) patients. Patients were included if tumor-informed mutations were detected either pre- or post-CRT. Data represent mean + SEM. P value was calculated by the Mann-Whitney test. (E) Correlation of ctDNA concentration (haploid genome equivalents per mL, hGE/mL) with pre-CRT metabolic tumor volume (MTV) measured by PET-CT, stratified by histology. P value and ρ were calculated by Pearson correlation.
Figure 2.
Figure 2.. Detection of tumor-informed mutations following chemoradiotherapy is strongly prognostic.
(A) Tumor variant allele fraction (VAF), stratified by whether and at which time point a patient had detectable ctDNA (x-axis categories) and further stratified by whether a given mutation was detectable in plasma (column colors). P value calculated by a 2-way ANOVA and was significant for difference based on if a mutation was detected in plasma (P = .01), but not for if a patient was detected pre- or post-CRT. (B) Tumor mutations detected in plasma pre- and post-CRT. Denominator is the total number of patients with detectable ctDNA, pre- and post-CRT (n=27 and n=5, respectively). Genes depicted were mutated in more than 5% of tumors in cBioportal ESCA datasets. (C-E) Kaplan–Meier analyses comparing patients with detectable and undetectable ctDNA in the post-CRT sample using tumor-informed ctDNA detection for (C) freedom from progression (P<.0001, HR = 18.7 (95%CI, 1.1–316.5)), (D) distant metastasis-free survival (P<.0001, HR = 32.1 (95%CI, 1.8–559.2)) and (E) disease-specific survival (P < .0001, HR = 23.1 (95%CI, 2.0–273.5)). ctDNA negative (n =26) versus ctDNA positive (n = 5). Time (days) was measured from the landmark (post-CRT blood draw). One patient was excluded from this analysis due to an event that occurred prior to the post-CRT blood collection. P values and hazard ratios were calculated from the log-rank test.
Figure 3.
Figure 3.. Putative emergent mutations following CRT may be associated with disease progression.
(A) In five patients we detected six new nonsynonymous mutations in post-CRT plasma that were absent pre-CRT. Column dot plots indicates allele fractions of both tumor-informed (circles) and emergent (squares) mutations. These mutations were absent in pre-CRT plasma and matched germline, tumor, and in 20 healthy controls. (B) Presence of putative emergent mutations in patients who developed disease progression (progressors; n = 10) versus those who did not (non-progressors; n = 20). P value derived from Fisher’s exact test. (C) Patient (EP32) with non-FDG avid stage II EAC treated with CRT-alone who developed an emergent ARID1A G696V mutation following CRT. This patient went on to develop distant metastasis (para-aortic lymph node). (D) Kaplan–Meier analysis of freedom from progression (P < .0001, HR = 13.2 (95%CI, 2.3–75.1)) comparing patients with or without detectable ctDNA post-CRT (n=8 and 23, respectively). Detectable ctDNA is defined as detection of tumor-informed or putative emergent mutations following CRT. Time (days) was measured from the landmark (post-CRT blood draw). P values and hazard ratios (HR) were calculated from the log-rank test. AF, allele fraction; CRT, chemoradiotherapy; IMRT, intensity modulated radiotherapy; EAC, esophageal adenocarcinoma.
Figure 4.
Figure 4.. ctDNA allows earlier and more robust detection of recurrence compared to PET-CT imaging.
(A) Kaplan–Meier analysis for event-free survival (P = .0026), comparing ctDNA detection at the post-CRT time point with standard-of-care PET-CT imaging (n=10). Time to event (days) was measured from end of CRT. P values and hazard ratios (HR) were calculated from the log-rank test. (B) Column dot plot of the lead time to radiographic recognition of recurrence for ctDNA detection (n=7), with the bars representing mean (114.9) and standard error of the mean (32.9). (C) Patient (EP58) with stage IIIA EAC with partial response to CRT on surveillance imaging and a decrease in post-CRT MTV but had increased levels of ctDNA post-CRT and experiences distant liver metastasis. (D) Patient (EP29) with stage IIB EAC with equivocal surveillance imaging, increased post-CRT MTV, and undetectable post-CRT ctDNA who achieves long-term survival.
Figure 5.
Figure 5.. Integrating ctDNA and ΔTLG enables improves detection of recurrence among patients receiving CRT alone.
Kaplan–Meier analysis for (A) freedom from progression (P=.0093, HR 6.4 (95% CI 1.2–33.1)) and (B) disease-specific survival (P=.015, HR 9.1 (95% CI 1.4–60.8)) stratified by post-CRT ctDNA detection among patients receiving CRT alone (n=12). Time to event (days) was measured from post-CRT PET imaging. P values and hazard ratios (HR) were calculated from the log-rank test. (C)Mean sensitivity and specificity of ctDNA, ΔTLG, and both, for any recurrence detection (n=12). ΔTLG is defined as the percent change in TLG in response to CRT. Mean and standard deviation calculated using leave-one-out approach. P values calculated by the Mann-Whitney test. Kaplan–Meier analysis for (D) freedom from progression (P=.0011) and (E) disease-specific survival (P=.026) stratified by integration of ctDNA detection and ΔTLG at the post-CRT time point (n=12). Patients in the red curve (n=7) either had detectable ctDNA following CRT or had ΔTLG ≥ −48.5% while patients in the blue curve (n=5) had undetectable ctDNA after CRT and had ΔTLG < −48.5%. Time to event (days) was measured from post-CRT PET imaging. P values were calculated from the log-rank test. Hazard ratios are not reported as they are undefined given the absence of any events in the ctDNA and ΔTLG negative group. (F) Patient (EP34) with stage IIA ESCC treated with CRT-alone who achieved long-term survival with no evidence of disease. Patient had detectable ctDNA pre-treatment and remains undetectable following CRT.

References

    1. van Hagen P, Hulshof MC, van Lanschot JJ, et al. Preoperative chemoradiotherapy for esophageal or junctional cancer. N Engl J Med 2012;366:2074–84. - PubMed
    1. Shapiro J, van Lanschot JJB, Hulshof M, et al. Neoadjuvant chemoradiotherapy plus surgery versus surgery alone for oesophageal or junctional cancer (CROSS): long-term results of a randomised controlled trial. Lancet Oncol 2015;16:1090–1098. - PubMed
    1. Noordman BJ, Spaander MCW, Valkema R, et al. Detection of residual disease after neoadjuvant chemoradiotherapy for oesophageal cancer (preSANO): a prospective multicentre, diagnostic cohort study. Lancet Oncol 2018. - PubMed
    1. Donahue JM, Nichols FC, Li Z, et al. Complete pathologic response after neoadjuvant chemoradiotherapy for esophageal cancer is associated with enhanced survival. Ann Thorac Surg 2009;87:392–8; discussion 398–9. - PMC - PubMed
    1. Bedenne L, Michel P, Bouche O, et al. Chemoradiation followed by surgery compared with chemoradiation alone in squamous cancer of the esophagus: FFCD 9102. J Clin Oncol 2007;25:1160–8. - PubMed

Publication types

MeSH terms

Supplementary concepts