. 2020 Jan;182(1):612-625.
doi: 10.1104/pp.19.00881. Epub 2019 Nov 11.

The Evening Complex Establishes Repressive Chromatin Domains Via H2A.Z Deposition

Affiliations

The Evening Complex Establishes Repressive Chromatin Domains Via H2A.Z Deposition

Meixuezi Tong et al. Plant Physiol. 2020 Jan.

Abstract

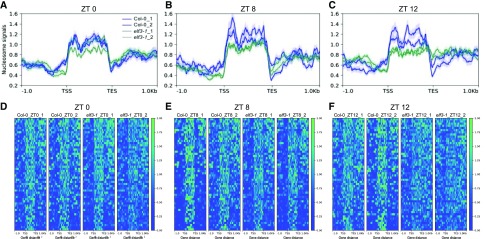
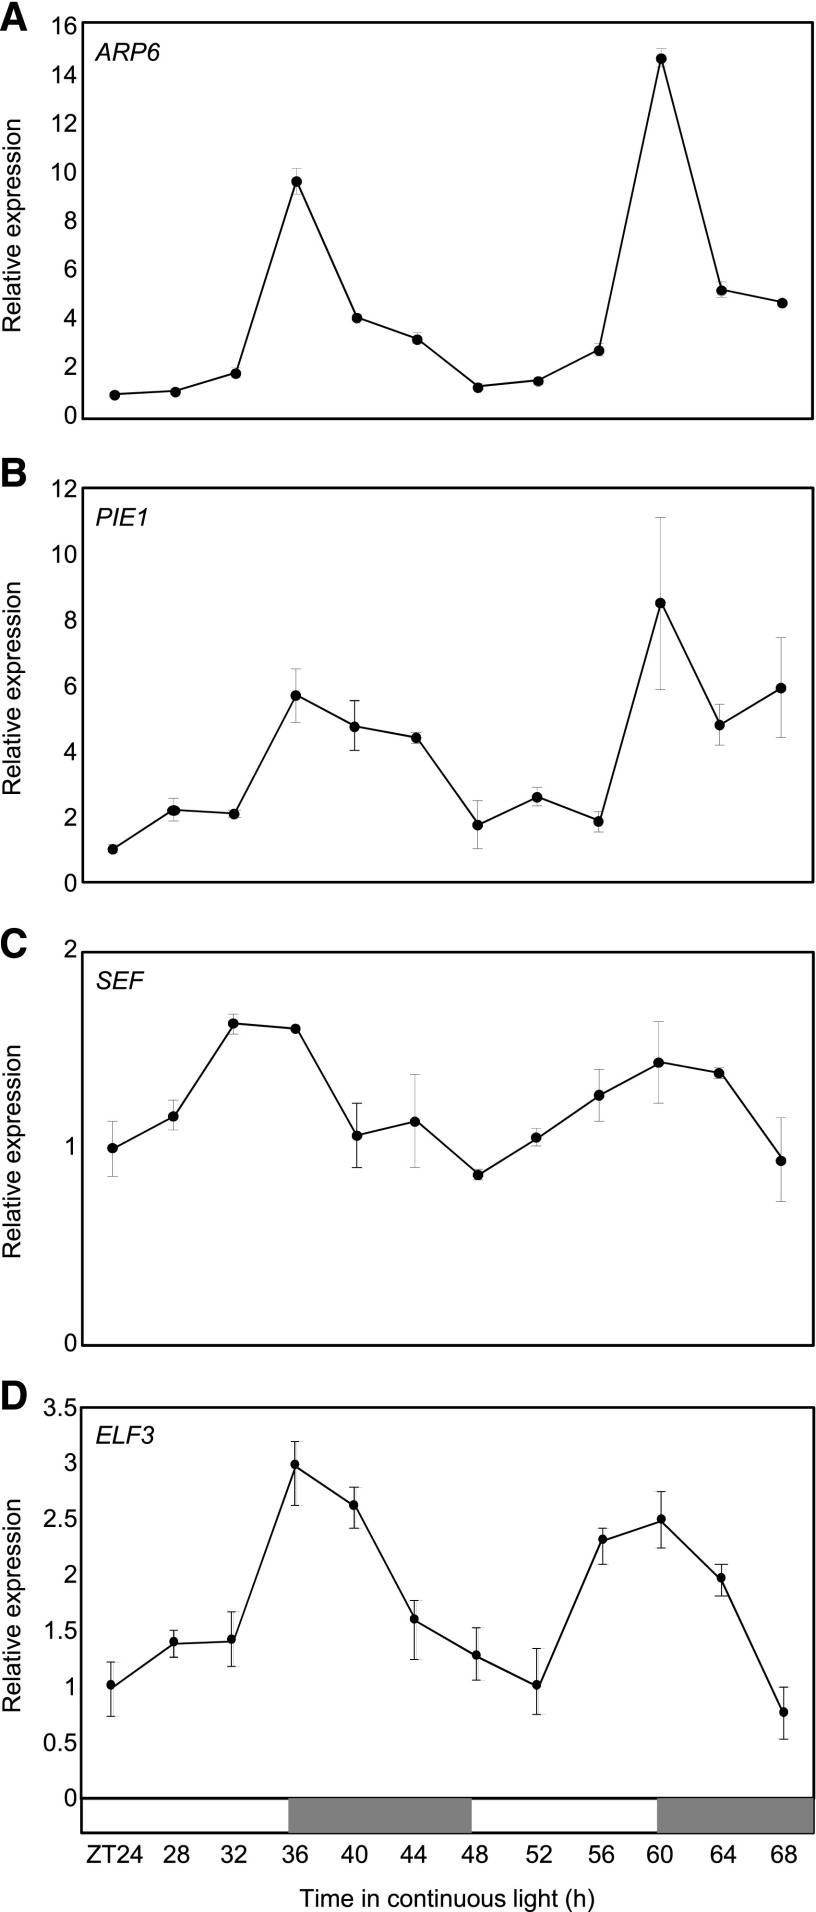
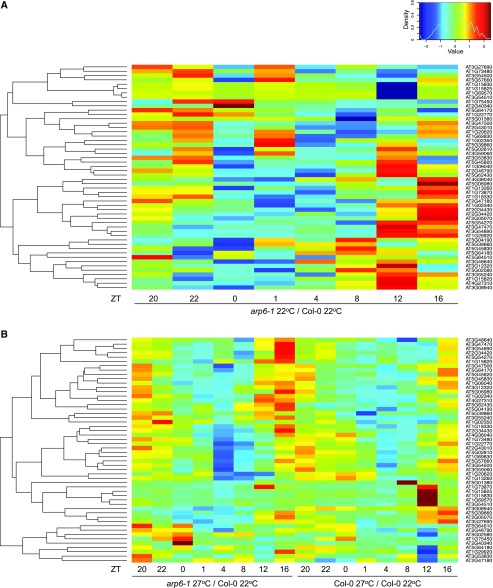
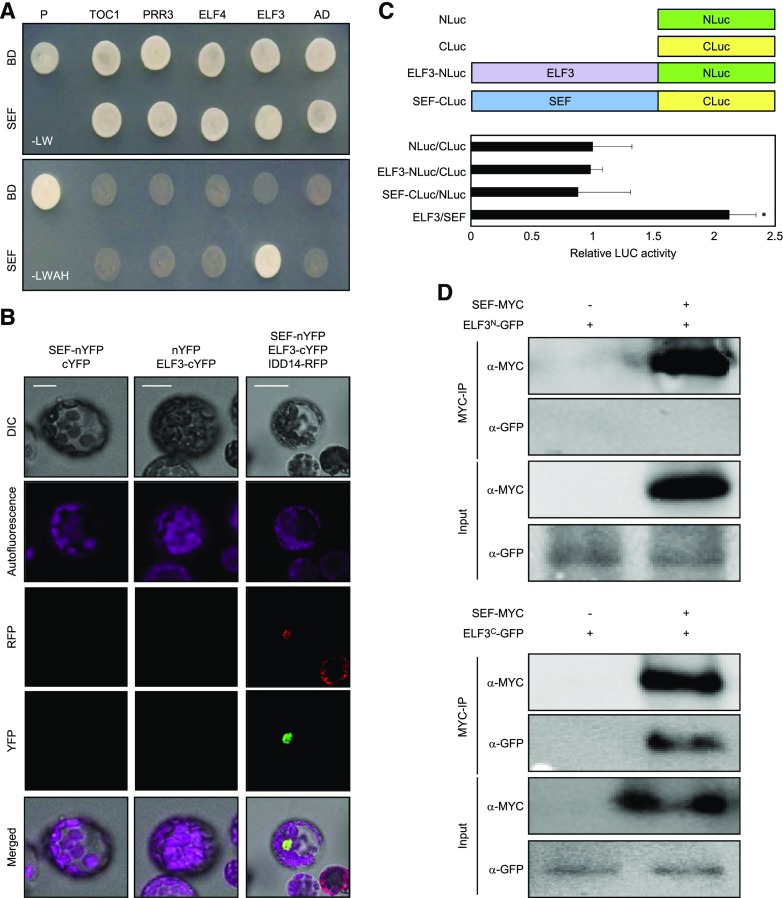
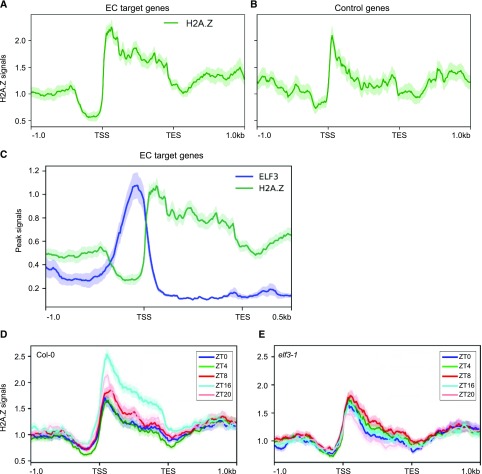
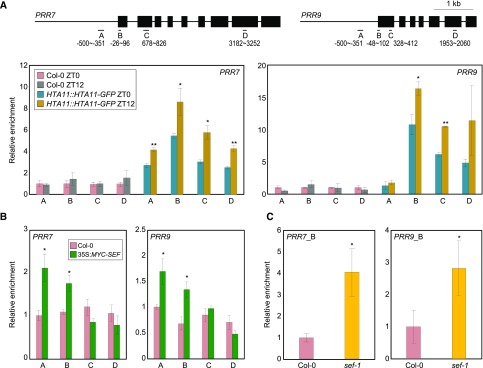
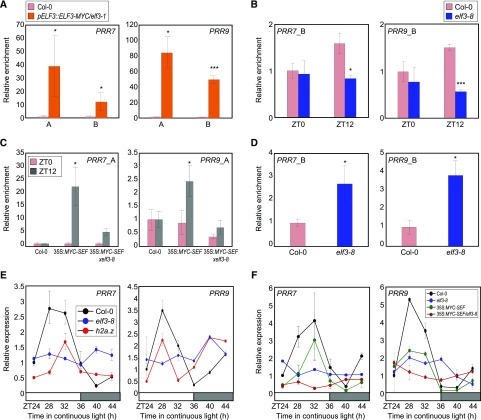
The Evening Complex (EC) is a core component of the Arabidopsis (Arabidopsis thaliana) circadian clock, which represses target gene expression at the end of the day and integrates temperature information to coordinate environmental and endogenous signals. Here we show that the EC induces repressive chromatin structure to regulate the evening transcriptome. The EC component ELF3 directly interacts with a protein from the SWI2/SNF2-RELATED (SWR1) complex to control deposition of H2A.Z-nucleosomes at the EC target genes. SWR1 components display circadian oscillation in gene expression with a peak at dusk. In turn, SWR1 is required for the circadian clockwork, as defects in SWR1 activity alter morning-expressed genes. The EC-SWR1 complex binds to the loci of the core clock genes PSEUDO-RESPONSE REGULATOR7 (PRR7) and PRR9 and catalyzes deposition of nucleosomes containing the histone variant H2A.Z coincident with the repression of these genes at dusk. This provides a mechanism by which the circadian clock temporally establishes repressive chromatin domains to shape oscillatory gene expression around dusk.


Figures

Figure 1.
Figure 1.
Nucleosome occupancy in EC target genes in Col-0 and elf3-1 at ZT0, 8, and 12. Average nucleosome signals (normalized MNase-seq reads) on 52 EC target genes (see also Supplemental Table S1) at ZT0, ZT8, and ZT12 (A–C) in Col-0 and elf3-1 grown under long day conditions. Heat map visualization of nucleosome signals over 52 EC target genes on Col-0 and elf3-1 at ZT0, ZT8, and ZT12 (d–F). Data are plotted from 1 kb upstream of TSSs to 1 kb downstream of transcription end site (TES) of EC target genes. Graphs show the results of two replicates.
Figure 2.
Figure 2.
Coexpression of the SWR1 components with EC. A to D, Circadian expression of SWR1 components and ELF3. Seedlings grown under neutral day conditions (12-h light: 12-h dark) for 2 weeks were transferred to continuous light conditions at ZT0. Whole seedlings were harvested from ZT24 to ZT68 to analyze transcript accumulation. Transcript levels of ARP6 (A), PIE1 (B), SEF (C), and ELF3 (D) were determined by RT-qPCR. Gene expression values were normalized to the eIF4A expression. Biological triplicates were averaged. Bars indicate the mean ± se. The white and gray boxes indicate the subjective day and night, respectively.
Figure 3.
Figure 3.
Elevated expression of EC target genes in arp6-1. Heat map visualization of log fold changes of the expression levels of EC target genes in arp6-1 at 22°C compared with Col-0 at 22°C grown under long day conditions (A) and in arp6-1 at 27°C compared with Col-0 at 22°C grown under short days (B). Values in (A) and (B) represent log2 (TPM in arp6-1 22°C/TMP in Col-0 22°C) and log2 (TPM in arp6-1 27°C/TMP in Col-0 22°C), respectively. The log fold change of the expression level of each gene was calculated by Z-score (mean = 0, sd = 1). The heat map was generated using the heatmap.2 function in R (v3.2.5).
Figure 4.
Figure 4.
Interactions of the SWR1 complex with EC. A, Y2H assays. Y2H assays were performed with the SEF protein fused to the DNA BD of GAL4 and evening-expressed clock components fused with the transcriptional AD of GAL4 for analysis of interactions. Interactions were examined by cell growth on selective media. -LWHA indicates Leu, Trp, His, and Ade drop-out plates. -LW indicates Leu and Trp drop-out plates. GAL4 was used as a positive control (P). B, BiFC assays. Partial fragments of YFP protein were fused with SEF and ELF3, and coexpressed in Arabidopsis protoplasts. Reconstituted fluorescence was examined by confocal microscopy. IDD14-RFP was used as a nucleus marker. Scale bars = 10 µm. DIC, differential interference contrast. C, Interaction of ELF3-NLuc with SEF-CLuc. Partial fragments of Luc (NLuc and CLuc) were fused with ELF3 or SEF. The fusion constructs were coexpressed in Arabidopsis protoplasts and Luc activities were measured and normalized against total protein. Three independent biological replicates were averaged and statistically analyzed with Student’s t test (*P < 0.05). Bars indicate the mean ± se. D, Co-IP assays. A. tumefaciens cells containing 35S:ELF3N(1-345aa)-GFP, 35S:ELF3C(346-695aa)-GFP, and 35S:SEF-MYC constructs were coinfiltrated to 3-week–old N. benthamiana leaves. Epitope-tagged proteins were detected immunologically using corresponding antibodies.
Figure 5.
Figure 5.
ELF3 and H2A.Z occupancy of EC target genes. A and B, H2A.Z enrichment (normalized HTA11-FLAG ChIP-seq reads) on 52 EC target genes (A) and control genes (B) was analyzed. For the class of “control genes,” a sample of 52 genes was randomly selected to compare their H2A.Z occupancy with EC target genes (see also Supplemental Table S2). (A) and (B) are plotted from 1 kb upstream of the TSS to 1 kb downstream of the TES of the corresponding genes. C, ELF3 and H2A.Z average binding plot on 52 EC target genes. D and E, H2A.Z enrichment in wild type (D) and elf3-1 mutant (E) at various time points under long day conditions.
Figure 6.
Figure 6.
H2A.Z deposition at PRR7 and PRR9 loci by the SWR1 complex. In (A) to (C), fragmented DNA was eluted from the protein–DNA complexes and used for qPCR analysis. Enrichment was normalized relative to eIF4A. Three independent biological replicates were averaged, and the statistical significance of the measurements was determined. Bars indicate the means ± se. A, Accumulation of H2A.Z at clock gene loci. Two-week–old plants grown under neutral day conditions were used for ChIP analysis with anti-GFP antibody. Gene structures are presented (upper representation). Underbars represent the amplified genomic regions. Statistically significant differences between ZT0 and ZT12 samples are indicated by asterisks (Student’s t test, *P < 0.05, **P < 0.01). B, Binding of SEF to clock gene promoters. Two-week–old 35S:MYC-SEF transgenic plants grown under neutral day conditions were harvested at ZT12. Statistically significant differences between wild-type and 35S:MYC-SEF plants are indicated by asterisks (Student’s t test, *P < 0.05). C, Recruitment of Pol II at PRRs in sef-1. Two-week–old plants grown under neutral day conditions were harvested at ZT12 and used for ChIP analysis with an anti-N terminus of Arabidopsis Pol II antibody. qPCR was performed with a primer pair amplifying the B region of each gene promoter (see also Fig. 6A). Statistically significant differences between wild-type and sef-1 plants are indicated by asterisks (Student’s t test, *P < 0.05).
Figure 7.
Figure 7.
H2A.Z exchange at PRR7 and PRR9 loci by ELF3. A, Binding of ELF3 to PRR promoters. Two-week–old pELF3::ELF3-MYC/elf3-1 seedlings grown under neutral day conditions were harvested at ZT12 and used to conduct ChIP assays. Statistically significant differences between Col-0 and pELF3::ELF3-MYC/elf3-1 plants are indicated by asterisks (Student’s t test, *P < 0.05, ***P < 0.001). B, H2A.Z deposition at clock gene promoters in elf3-8. Two-week–old plants grown under neutral day conditions were used for ChIP analysis with anti-H2A.Z antibody. Statistically significant differences between Col-0 and elf3-8 plants are indicated by asterisks (Student’s t test, *P < 0.05, ***P < 0.001). C, SEF binding to the PRR loci in elf3-8 background. Two-week–old plants grown under neutral day conditions were used for ChIP analysis with anti-MYC antibody. Statistically significant differences between ZT0 and ZT12 samples are indicated by asterisks (Student’s t test, *P < 0.05). D, Recruitment of Pol II at clock gene promoters in elf3-8. Two-week–old plants grown under neutral day conditions were harvested at ZT12 and used for ChIP analysis with an anti-N terminus of Arabidopsis Pol II antibody. Statistically significant differences between ZT0 and ZT12 samples are indicated by asterisks (Student’s t test, *P < 0.05). In (A) to (D), fragmented DNA was eluted from the protein–DNA complexes and used for qPCR analysis. Enrichment was normalized relative to eIF4A. Three independent biological replicates were averaged, and the statistical significance of the measurements was determined. Bars indicate the mean ± se. E, Circadian expression of PRR7 and PRR9 in elf3-8 and h2a.z. F, PRR expression in 35S:MYC-SEF/elf3-8. In (E) and (F), seedlings grown under neutral day conditions for 2 weeks were transferred to continuous light conditions at ZT0.

References

    1. Alabadí D, Oyama T, Yanovsky MJ, Harmon FG, Más P, Kay SA (2001) Reciprocal regulation between TOC1 and LHY/CCA1 within the Arabidopsis circadian clock. Science 293: 880–883 - PubMed
    1. Anders S, Pyl PT, Huber W (2015) HTSeq—a Python framework to work with high-throughput sequencing data. Bioinformatics 31: 166–169 - PMC - PubMed
    1. Bolger AM, Lohse M, Usadel B (2014) Trimmomatic: A flexible trimmer for Illumina sequence data. Bioinformatics 30: 2114–2120 - PMC - PubMed
    1. Box MS, Huang BE, Domijan M, Jaeger KE, Khattak AK, Yoo SJ, Sedivy EL, Jones DM, Hearn TJ, Webb AAR, et al. (2015) ELF3 controls thermoresponsive growth in Arabidopsis. Curr Biol 25: 194–199 - PubMed
    1. Carré IA, Kim JY (2002) MYB transcription factors in the Arabidopsis circadian clock. J Exp Bot 53: 1551–1557 - PubMed

Publication types

MeSH terms