. 2019 Dec 20;294(51):19764-19784.
doi: 10.1074/jbc.RA119.011337. Epub 2019 Nov 11.

Template-switching mechanism of a group II intron-encoded reverse transcriptase and its implications for biological function and RNA-Seq

Affiliations

Template-switching mechanism of a group II intron-encoded reverse transcriptase and its implications for biological function and RNA-Seq

Alfred M Lentzsch et al. J Biol Chem. .

Abstract

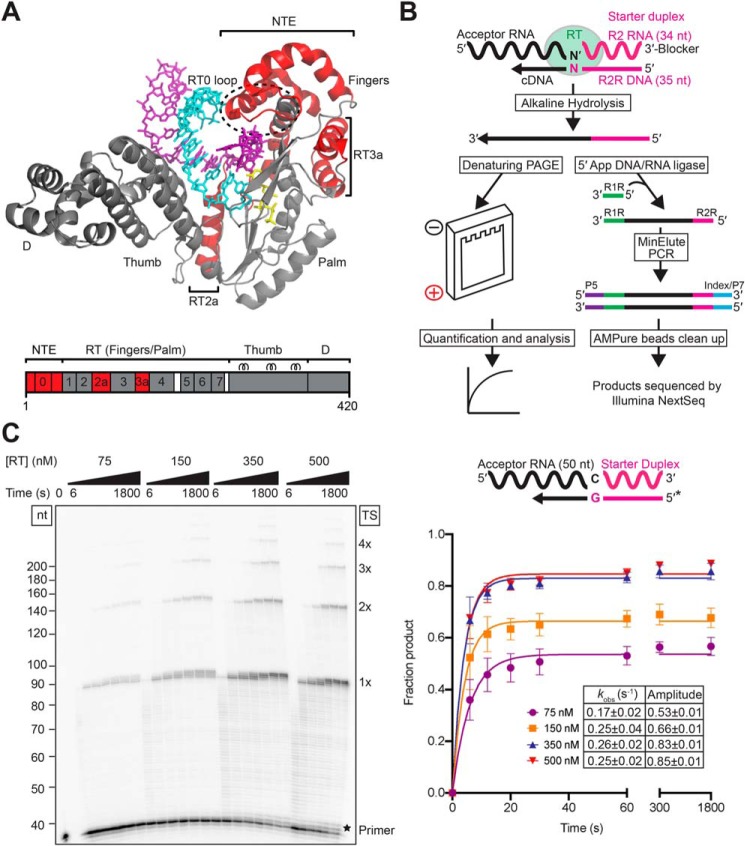
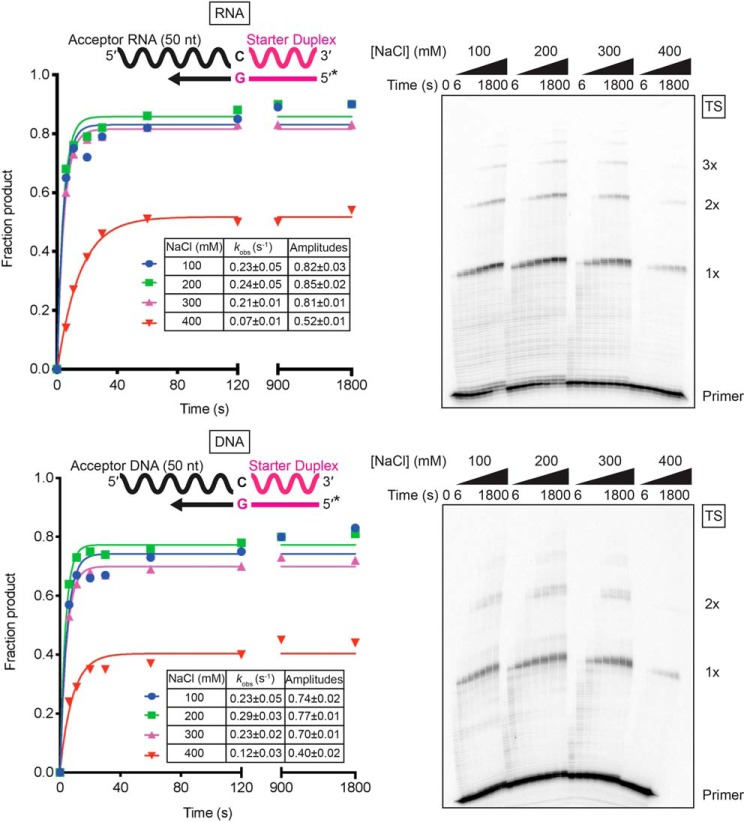
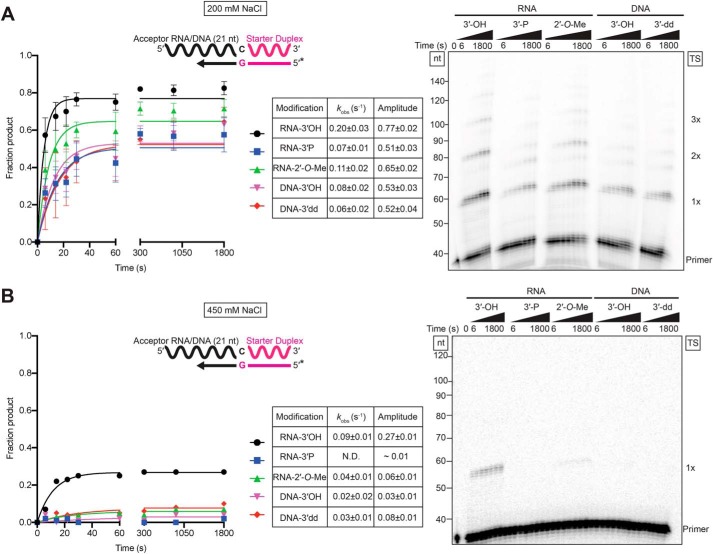
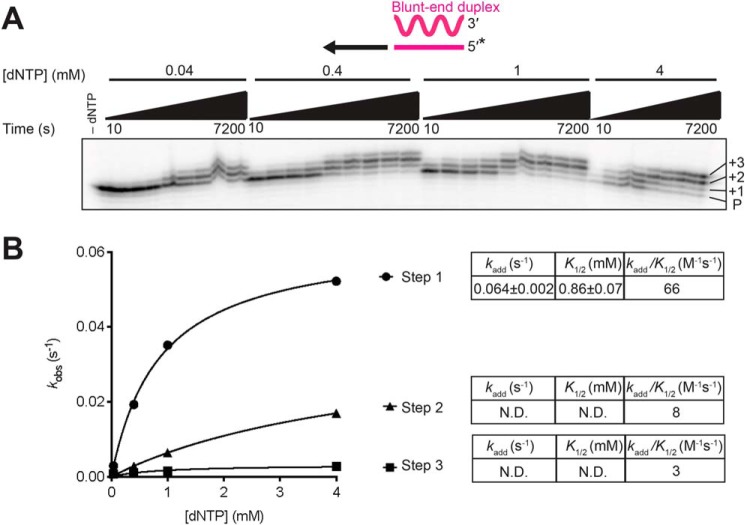
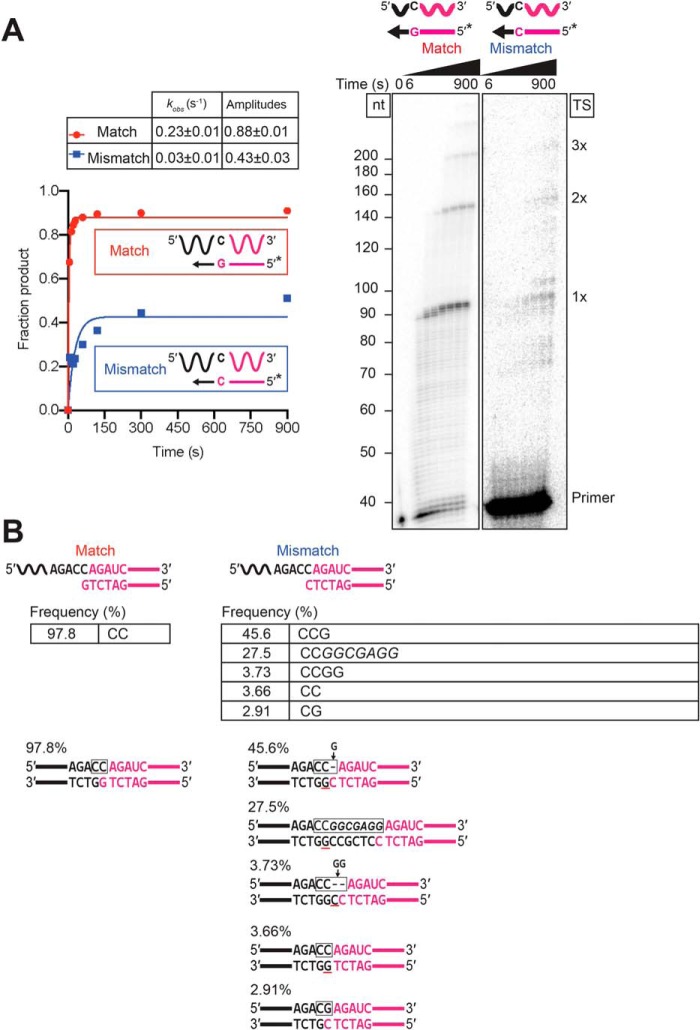
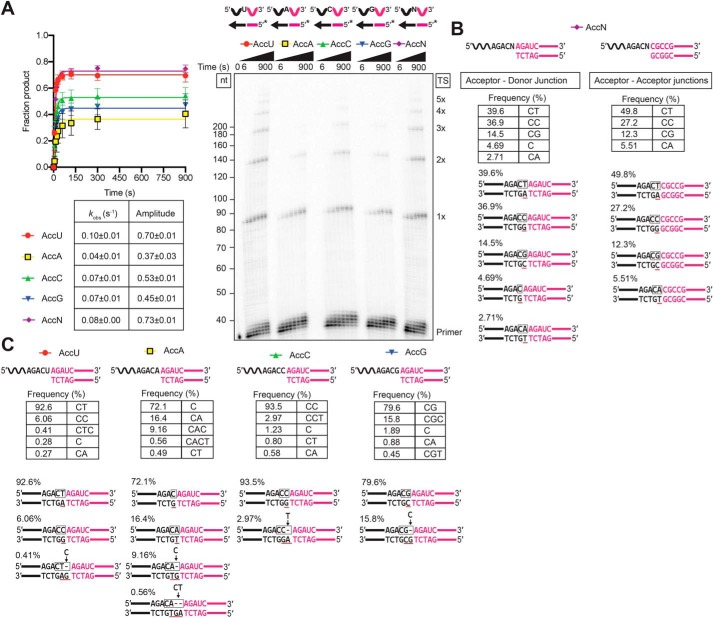
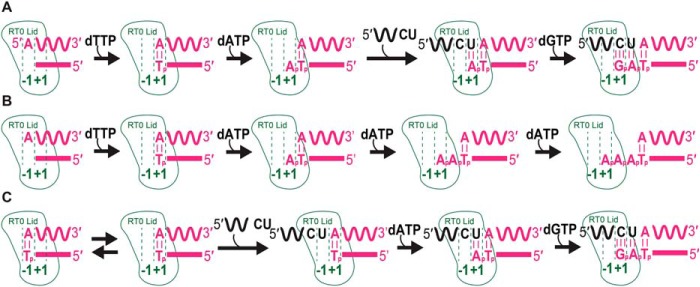
The reverse transcriptases (RTs) encoded by mobile group II introns and other non-LTR retroelements differ from retroviral RTs in being able to template-switch efficiently from the 5' end of one template to the 3' end of another with little or no complementarity between the donor and acceptor templates. Here, to establish a complete kinetic framework for the reaction and to identify conditions that more efficiently capture acceptor RNAs or DNAs, we used a thermostable group II intron RT (TGIRT; GsI-IIC RT) that can template switch directly from synthetic RNA template/DNA primer duplexes having either a blunt end or a 3'-DNA overhang end. We found that the rate and amplitude of template switching are optimal from starter duplexes with a single nucleotide 3'-DNA overhang complementary to the 3' nucleotide of the acceptor RNA, suggesting a role for nontemplated nucleotide addition of a complementary nucleotide to the 3' end of cDNAs synthesized from natural templates. Longer 3'-DNA overhangs progressively decreased the template-switching rate, even when complementary to the 3' end of the acceptor template. The reliance on only a single bp with the 3' nucleotide of the acceptor together with discrimination against mismatches and the high processivity of group II intron RTs enable synthesis of full-length DNA copies of nucleic acids beginning directly at their 3' end. We discuss the possible biological functions of the template-switching activity of group II intron- and other non-LTR retroelement-encoded RTs, as well as the optimization of this activity for adapter addition in RNA- and DNA-Seq protocols.

Keywords: DNA sequencing; RNA; RNA sequencing; RNA virus; RNA-dependent RNA polymerase; chemical biology; enzyme kinetics; group II intron reverse transcriptase; non-templated nucleotide addition; retrovirus; reverse transcription; structure–function; thermostable group II intron reverse transcriptase; transposable element (TE); viral polymerase.


Conflict of interest statement

Thermostable group II intron reverse transcriptase enzymes and methods for their use are the subject of patents and patent applications that have been licensed by the University of Texas and East Tennessee State University to InGex, LLC. A. M. Lambowitz, some former and present members of the Lambowitz laboratory, and the University of Texas are minority equity holders in InGex, LLC, and receive royalty payments from the sale of TGIRT enzymes and kits employing TGIRT template-switching activity for RNA-seq adapter addition and from the sublicensing of intellectual property to other companies

Figures

Figure 1.
Figure 1.
Overview of template-switching experiments and determination of saturating enzyme concentrations. A, structure of GsI–IIC RT bound to RNA template/DNA primer and incoming dNTP (Protein Data Bank code 6AR1) (41). The NTE, RT2a, and RT3a insertions, which are not present in retroviral RTs, are colored red and delineated by brackets, with the RT0 loop encircled by a dashed line. Other protein regions are labeled and colored gray. The DNA primer and RNA template are shown in stick representation and are colored cyan and purple, respectively, and dATP bound at the RT active site is also shown in stick representation and colored yellow. The GsI–IIC RT used to obtain the crystal structure has a C-terminal His8 tag, whereas that used for biochemical analysis has an N-terminal maltose-binding protein tag to keep the protein soluble in the absence of bound nucleic acids (6). The schematic at the bottom shows the GsI–IIC RT protein with different regions color-coded to the crystal structure. RT-1 to RT-7 are conserved RT sequence blocks found in all RTs. D denotes the C-terminal DNA-binding domain that functions in recognition of DNA target sites during retrohoming (38). B, outline of template-switching experiments. GsI–IIC RT was pre-bound to a starter duplex (magenta) consisting of a 34-nt RNA oligonucleotide containing an Illumina Read 2 (R2) sequence annealed to a complementary 35-nt DNA primer (R2R) leaving a 1-nt, 3′-DNA overhang (N) (Table S1). The 3′ overhang nucleotide (N) base pairs with the 3′ nucleotide (N′) of an acceptor RNA (black) for template switching, leading to the synthesis of a full-length cDNA of the acceptor RNA with the R2R adapter linked to its 5′ end. The cDNAs were incubated with NaOH to degrade RNA and neutralized with equimolar HCl prior to further analysis (see “Experimental procedures” for details). For the biochemical experiments (left branch), the R2R DNA primer in the starter duplex was 5′-32P-labeled, and the cDNA products were analyzed by electrophoresis in a denaturing polyacrylamide gel, which was dried and quantified with a phosphorimager. For RNA-Seq experiments (right branch), the cDNAs were cleaned up by using a Qiagen MinElute column (not shown) prior to ligating a 5′-adenylated R1R adapter to the 3′ end of the cDNA using the Thermostable 5′ App DNA/RNA Ligase (New England Biolabs). After another MinElute cleanup, Illumina RNA-Seq capture sites (P5 and P7) and indexes were added by PCR, and the resulting libraries were cleaned up by using AMPure XP beads (Beckman Coulter) prior to sequencing on an Illumina NextSeq 500. C, determination of saturating enzyme concentrations. Template-switching reactions included various concentrations of GsI–IIC RT as indicated, 50 nm RNA template/DNA primer starter duplex (5′-32P-labeled on DNA primer indicated by *), 100 nm of a 50-nt RNA acceptor template, and 4 mm dNTPs (an equimolar mix of 1 mm dATP, dCTP, dGTP, and dTTP) in reaction medium containing 200 mm NaCl at 60 °C. Aliquots were quenched at times ranging from 6 to 1,800 s, and the products were analyzed by denaturing PAGE, as described under “Experimental procedures.” The numbers to the left of the gel indicate size markers (a 5′-32P-labeled ssDNA ladder; ss20 DNA Ladder, Simplex Sciences) run in a parallel lane, and the labels to the right of the gel indicate the products resulting from the initial template switch (1×) and subsequent end–to–end template switches from the 5′ end of one acceptor to the 3′ end of another (2×, 3×, etc.) The star at the bottom right of the gel indicates the position of bands resulting from NTA to the 3′ end of the DNA primer. The plot at right shows time courses for the production of template-switching products (i.e. products >2 nt larger than the primer), with each data set fit by a single-exponential function, and the error bars indicate the standard deviations for three experiments. The inset table indicates the kobs, and amplitude parameters obtained from the fit of an exponential function to the average values from three independent determinations, along with standard errors obtained from the fit (see “Experimental procedures”).
Figure 2.
Figure 2.
Template switching to RNA and DNA is more efficient at lower salt concentrations. Template-switching reaction time courses with 100 nm of 50-nt RNA (top) or DNA (bottom) acceptors of identical sequence (Table S1) were done with 500 nm GsI–IIC RT and 50 nm starter duplex with a 5′-32P-labeled (*) DNA primer in reaction medium containing 100, 200, 300, or 400 mm NaCl. Time points were taken at intervals ranging from 6 to 1,800 s, and the products were analyzed by denaturing PAGE, as described in Fig. 1B. The plots to the left of the gel show the data fit by a single-exponential function to calculate the kobs and amplitude for each time course, and the values are summarized in the inset tables together with the standard error of the fit. The gels are labeled as in Fig. 1.
Figure 3.
Figure 3.
Lower salt concentration increases template switching to acceptor RNAs ending with 3′-phosphate or 2′-O-Me groups. A and B, time courses of template switching to 21-nt RNA and DNA acceptors of identical sequence but different 3′ end modifications (Table S1) at 200 and 450 mm NaCl, respectively. The RNA acceptors had a 3-hydroxyl (OH), 3′-phosphate (3′-P), or 2′-O-methyl (2′-O-Me) group, and the DNA acceptors had a 3′ hydroxyl (OH) or a dideoxy (3′-dd) terminus. Reactions were done using 500 nm GsI–IIC RT, 100 nm acceptor RNA or DNA, and 50 nm starter duplex with a 5′-32P-labeled (*) DNA primer. Time points were taken at intervals ranging from 6 to 1,800 s, and the products were analyzed by denaturing PAGE, as described in Fig. 1. The plots to the left of the gel show the data fit by a single-exponential function to calculate the kobs and amplitude for each reaction, and the values and standard errors of the fit are shown in the tables to the right of the plots. The gels are labeled as in Fig. 1. N.D., not determined.
Figure 4.
Figure 4.
Non-templated nucleotide addition activity of GsI–IIC RT using a mixture of all four dNTPs. Reactions included 500 nm GsI-II RT and 50 nm of a blunt-end starter duplex with 5′-32P-labeled (*) DNA primer in reaction medium containing 200 mm NaCl and varying dNTP concentrations (0.04, 0.4, 1, and 4 mm, where 4 mm is an equimolar mix of 1 mm dATP, dCTP, dGTP, and dTTP). Aliquots were stopped after times ranging from 10 to 7,200 s, and the products were analyzed by electrophoresis in a denaturing polyacrylamide gel, which was dried and scanned with a phosphorimager. Each product band was quantified individually and summed to estimate the rate of step 1. Product bands 2 and 3 were summed to estimate the rate of step 2, and product band 3 was used to estimate the rate of step 3. The data were plotted and fit by a single-exponential function to calculate the kobs and amplitude parameters for each reaction. A, representative gel showing the labeled DNA primer (P) and bands resulting from NTA of 1, 2, and 3 nucleotides to the 3′ end of the DNA. B, plot of kobs values as a function of dNTP concentration fit by a hyperbolic function to calculate kadd, the catalytic rate at saturating substrate concentration; K½, the substrate concentration at half-maximum kadd; and kadd/K½ for each NTA step (values summarized in tables to the right of the plots). The individual parameter values kadd and K½ were not well-defined for steps two and three because saturation was not reached at 4 mm dNTP, and they are therefore indicated as N.D. (not determined). Although the progress curve of the second and third NTA products (Fig. S4) would be expected to include kinetic lags in principle, the rate constants for NTA are progressively lower with repeated additions, such that the data for these additions are adequately described by simple exponential functions without lag phases. All reactions were performed at least twice, and some time points were collected three times. Data were averaged for each time point, and these averages were fit by a single-exponential function to obtain the kobs values.
Figure 5.
Figure 5.
Nucleotide preferences for non-templated nucleotide addition activity. A, second-order rate constants of NTA activity using individual dNTPs for the first step (blunt-end starter duplex, top) and second step (1-nt G overhang starter duplex, bottom) are shown. The kinetic parameters for kadd and K½ were obtained as described in Fig. 4. Gels and plots are shown in Fig. S5; reaction conditions are given in the Fig. S5 legend, and kinetic values are summarized in Table S1. B, plots showing global data fitting of consecutive dATP addition (Fig. S5) to a blunt-end starter duplex at 4 mm dATP. Each color represents a unique species in the reaction pathway: red, blunt-end starter duplex; green, product after first NTA; blue, product after second NTA; black, product after third NTA. C, global model used for NTA reactions with dATP is shown with the parameters obtained from global fitting. Analogous schemes for NTA of the other dNTPs are shown in Fig. S6.
Figure 6.
Figure 6.
Template switching is favored by a single nucleotide 3′ overhang. Reactions used 50 nm starter duplexes with a blunt end (0 overhang) or 1-, 2-, or 3-nt 3′ overhangs, 500 mm GsI–IIC RT, 100 nm 50-nt acceptor RNA in reaction medium containing 200 mm NaCl and were done at 60 °C. The schematics above the gel diagrams the reactions with starter duplexes having a 5′-32P-labeled (*) DNA primer and different numbers of 3′ overhang nucleotides. Reactions were stopped after times ranging from 5 to 1,800 s, and the products were analyzed by denaturing PAGE and quantified from phosphorimager scans of the dried gel. The plots show the data fit by a single-exponential function to calculate the kobs and amplitude for each time course, and the values are summarized in the table below together with the standard error of the fit. The gel is labeled as in Fig. 1.
Figure 7.
Figure 7.
Template switching is directed by a single base pair between the 1-nt 3′ DNA overhang and the 3′ nucleotide of the acceptor RNA. Template-switching reactions with 50-nt acceptor RNAs (100 nm) differing only in their 3′ nucleotide and starter duplexes having a complementary 1-nt 3′ DNA (50 nm) were done with 500 nm GsI–IIC RT at 60 °C in reaction medium containing 200 mm NaCl. A, time courses. Template-switching reactions with 32P-labeled (*) starter duplexes were stopped after times ranging from 6 to 900 s, and the products were analyzed by denaturing PAGE and quantified from a phosphorimager scan of the dried gel. The gel (right) is labeled as in Fig. 1. The plots (left) show the time course data fit by a single-exponential function to calculate the kobs and amplitude for each time course, with the values and standard error of the fit summarized in the table below. B, RNA-Seq analysis of template-switching junctions. Template-switching reactions with unlabeled starter duplexes were done under the same conditions as in A with the reaction stopped after 15 min. RNA-Seq analysis was done as described in Fig. 1 and under “Experimental procedures.” The figure diagrams the template-switching reaction for each acceptor/starter duplex combination above, with the sequences and percentages of the most frequent template-switching junctions (≥0.1%) for each combination listed below. Nucleotides derived from the acceptor are in black, and nucleotides derived from the starter duplex are in red, with the box indicating the junction sequence. A black letter with red underline indicates a nucleotide inferred to result from NTA to the 3′ end of the DNA primer. A gap in the top strand due to NTA is shown as a dash, and nucleotides inferred to fill the gap after PCR to add RNA-Seq adapters (Fig. 1A) are shown above the line with an arrow pointing to the gap. The low frequency junctions containing an extra nucleotide (CTT for the 3′-U acceptor (0.17%), CCC for the C acceptor (0.12%), and CGG for the 3′-G acceptor (0.14%)) can be explained by template switching from donors that have undergone an NTA of a complementary nucleotide resulting in a 2′-nt 3′ overhang that leaves a gap in the top strand, which is filled by a complementary nucleotide during the PCR used to add RNA-Seq adapters. Other aberrant products may reflect heterogeneity or resections at the 3′ ends of the synthesized oligonucleotides (e.g. the 3′-C junction for the 3′-C acceptor (1.33%) can be explained by template switching to a mis-synthesized or resected acceptor RNA lacking the terminal C residue). Complete data for junction sequences are shown in Table S3.
Figure 8.
Figure 8.
Biases in 3′-adapter addition in TGIRT-seq reflect the efficiency of template switching to acceptor RNAs with different 3′ nucleotides at a high-salt concentration. A, template-switching reactions with 50-nt acceptor RNAs differing only in their 3′ nucleotide and 32P-labeled (*) starter duplexes having a complementary 1-nt 3′ DNA overhang were done as in Fig. 7, but in reaction medium containing 450 mm instead of 200 mm NaCl. B, template-switching reactions were done as in A, but with 10 nm instead of 100 nm acceptor RNA in reaction medium containing either 200 mm NaCl (LS) or 450 mm NaCl (HS). The gels are labeled as in Fig. 1. The plots to the left of the gel show the time course data fit by a single-exponential function to calculate the kobs and amplitude for each time course, and the values and standard errors of the fit are summarized in the tables below the plots.
Figure 9.
Figure 9.
Template switching by GsI–IIC RT disfavors the extension of mismatches. Template-switching reactions to a 50-nt acceptor RNA with a 3′-C residue using starter duplexes having either a complementary 1-nt 3′-G overhang (matched) or a non-complementary 1-nt 3′-C overhang (mismatched) were done as described in Fig. 7. A, time courses. Template-switching reactions with 32P-labeled (*) starter duplexes were stopped after times ranging from 6 to 900 s, and the products were analyzed by denaturing PAGE and quantified from phosphorimager scans of the dried gel. The gels (different exposures for the matched and mismatched configurations) are labeled as in Fig. 1. The plots to the left of the gel show the data fit by a single-exponential function to calculate the kobs and amplitude for each time course, and the values together with the standard error of the fit are summarized in the table above. B, RNA-Seq analysis of template-switching junctions. Template-switching reactions with unlabeled starter duplexes were done under the same conditions as in A with the reaction stopped after 15 min. RNA-Seq analysis was done as described in Fig. 1 and “Experimental procedures.” The figure diagrams the template-switching reaction for each acceptor/starter duplex combination above, with the sequences and percentages of the most frequent template-switching junctions for the mismatched combination shown below. Nucleotides that were derived from the acceptor are in black, and nucleotides derived from the starter duplex are in red, with the box indicating the junction sequence. A black letter with red underline indicates a nucleotide residue inferred to result from NTA. A gap in the top strand due to NTA is shown as a dash, and nucleotides inferred to fill the gap after PCR to add RNA-Seq adapters are indicated above the line with arrows pointing to the gap. Nucleotides in italics are putatively derived from an intermediate template switch to contaminating oligonucleotides present in the enzyme preparation or reagents. Complete data for junction sequences are shown in Table S3.
Figure 10.
Figure 10.
Template switching from a blunt-end starter duplex is inefficient and yields heterologous junction sequences. Template-switching reactions with 50-nt acceptor RNAs (100 nm) differing only in their 3′-nucleotide residue and a blunt end-starter R2 RNA/R2R DNA starter duplex (50 nm) were done as described in Fig. 7. The 3′-N acceptor is an equimolar mix of acceptor RNAs having 3′ A, C, G, or U residues added at the same total concentration (100 nm) as each individual acceptor. A, time courses. Template-switching reactions with 32P-labeled (*) starter duplexes were stopped after times ranging from 6 to 900 s, and the products were analyzed by denaturing PAGE and quantified from phosphorimager scans of the dried gel. The gel is labeled as in Fig. 1. The plot to the left of the gel shows the data for each acceptor fit by a single-exponential function, with the values and standard error of the fit summarized in the table below the plot. B and C, RNA-Seq analysis of template-switching junctions between the acceptor RNAs and unlabeled blunt-end duplex were done for 15 min under the same conditions as in A. The figure diagrams the template-switching reaction for each combination, with the sequences and frequencies of the most frequent template-switching junctions shown below. B shows sequences and frequencies for both the initial Acceptor–Donor junctions and subsequent Acceptor–Acceptor junctions, and C shows only those for the initial Acceptor–Donor junctions. Nucleotides that were derived from the acceptor RNA are in black, and nucleotides derived from the synthetic blunt-end duplex or blunt-end duplexes formed after completion of cDNA synthesis are in red, with the box indicating the junction sequence. A black letter with red underline indicates a nucleotide inferred to result from NTA to a blunt-end duplex. Gaps in the top strand due to NTA are shown as dashes, and nucleotides inferred to fill those gaps after PCR to add RNA-Seq adapters are indicated above the line with arrows pointing to the gap. Complete data for junction sequences are shown in Table S3.
Figure 11.
Figure 11.
Models of template switching and non-templated nucleotide addition reactions. A, template switching to an acceptor RNA from an RNA template/DNA primer heteroduplex with a 1-nt 3′ overhang added by NTA after completion of cDNA synthesis or as an artificial starter duplex. B, NTA to a blunt-end RNA/DNA heteroduplex in the absence of an acceptor nucleic acid. C, template-switching to an acceptor RNA from a blunt-end RNA/DNA heteroduplex without NTA. See under “Discussion” for details.

References

    1. Coffin J. M. (1979) Structure, replication, and recombination of retrovirus genomes: some unifying hypotheses. J. Gen. Virol. 42, 1–26 10.1099/0022-1317-42-1-1 - DOI - PubMed
    1. Gilboa E., Mitra S. W., Goff S., and Baltimore D. (1979) A detailed model of reverse transcription and tests of crucial aspects. Cell 18, 93–100 10.1016/0092-8674(79)90357-X - DOI - PubMed
    1. Peliska J. A., and Benkovic S. J. (1992) Mechanism of DNA strand transfer reactions catalyzed by HIV-1 reverse transcriptase. Science 258, 1112–1118 10.1126/science.1279806 - DOI - PubMed
    1. Zhu Y. Y., Machleder E. M., Chenchik A., Li R., and Siebert P. D. (2001) Reverse transcriptase template switching: a SMART approach for full-length cDNA library construction. BioTechniques 30, 892–897 10.2144/01304pf02 - DOI - PubMed
    1. Eickbush T. H., and Jamburuthugoda V. K. (2008) The diversity of retrotransposons and the properties of their reverse transcriptases. Virus Res. 134, 221–234 10.1016/j.virusres.2007.12.010 - DOI - PMC - PubMed

Publication types

Associated data