Review
. 2020 Jan 3;295(1):15-33.
doi: 10.1074/jbc.REV119.006794. Epub 2019 Nov 11.

Successes and challenges in simulating the folding of large proteins

Affiliations
Review

Successes and challenges in simulating the folding of large proteins

Anne Gershenson et al. J Biol Chem. .

Abstract

Computational simulations of protein folding can be used to interpret experimental folding results, to design new folding experiments, and to test the effects of mutations and small molecules on folding. However, whereas major experimental and computational progress has been made in understanding how small proteins fold, research on larger, multidomain proteins, which comprise the majority of proteins, is less advanced. Specifically, large proteins often fold via long-lived partially folded intermediates, whose structures, potentially toxic oligomerization, and interactions with cellular chaperones remain poorly understood. Molecular dynamics based folding simulations that rely on knowledge of the native structure can provide critical, detailed information on folding free energy landscapes, intermediates, and pathways. Further, increases in computational power and methodological advances have made folding simulations of large proteins practical and valuable. Here, using serpins that inhibit proteases as an example, we review native-centric methods for simulating the folding of large proteins. These synergistic approaches range from Gō and related structure-based models that can predict the effects of the native structure on folding to all-atom-based methods that include side-chain chemistry and can predict how disease-associated mutations may impact folding. The application of these computational approaches to serpins and other large proteins highlights the successes and limitations of current computational methods and underscores how computational results can be used to inform experiments. These powerful simulation approaches in combination with experiments can provide unique insights into how large proteins fold and misfold, expanding our ability to predict and manipulate protein folding.

Keywords: MD simulations; all-atom-based methods; computer modeling; molecular dynamics; multidomain proteins; native-centric simulations; protein folding; protein misfolding; serpin; structure-based model (SBM); tertiary structure.


Conflict of interest statement

Pietro Faccioli is a cofounder of Sibylla Biotech, a startup company focused on using advanced molecular simulation methods to develop new therapeutics

Figures

Figure 1.
Figure 1.
Cartoons showing funneled energy landscapes of protein folding. A, energy landscape of a realistic protein in which the funneled landscape is rugged and contains local minima and barriers that can lead to long-lived intermediate states. B, idealized perfectly smooth energy landscape of a much less frustrated protein. This type of smooth landscape is encoded in the simplest Gō models. Images were obtained from http://dillgroup.org/#/landscapes6 and used with permission under Creative Commons BY 4.0 license.
Figure 2.
Figure 2.
Gō (SBM) model schematic. Coarse graining sets the chain connectivity while encoding the native structure. Two types of constraints are encoded in these models: (i) local along the polypeptide chain constraints consisting of bond constraints between two consecutive beads, angular constraints between three consecutive beads, and dihedral potentials between four consecutive beads; (ii) longer-distance contact interactions, which are attractive when two beads are within the contact distance in the native structure and are otherwise repulsive, accounting for the excluded volume of the beads. In some implementations, nonnative attractive interactions replace these repulsive interactions.
Figure 3.
Figure 3.
The BF method for simulating protein folding using all-atom force fields and ratchet-and-pawl MD. A, schematic view of multiple folding trajectories from the BF approach to transition path sampling. In the BF approach, the force field, V(R), is a conventional, all-atom force field (e.g. Amber or CHARMM) plus the history-dependent ratchet-and-pawl bias allowing for the efficient production of multiple, trial folding trajectories (lines in the funnel). The ratchet-and-pawl (right) bias limits backtracking, and the least biased trajectories (red) are selected for analysis. (The ratchet figure is from Antoni Espinosa (commons.wikimedia.org/wiki/File:Trinquete.png).6 The funnel is from the Oas laboratory at Duke University (https://oaslab.com/Drawing_funnels.html).6 B, schematic explanation of the steps involved in implementing the BF method for folding simulations adapted from Wang et al. (31). In the initial step, the protein of interest is unfolded using high-temperature MD simulations. BF folding simulations are then performed using the force field defined above, and multiple trial folding trajectories are generated. Note that folding is not always successful, and some protein molecules fail to fold completely or misfold, and these results may be particularly pronounced for mutant proteins. Folding and misfolding trajectories with minimum biasing (yellow lines) are identified and analyzed.
Figure 4.
Figure 4.
Inhibitory serpin structure and function. Shown is an active, metastable AAT structure (PDB entry 1QLP) (88) with a solvent-accessible RCL (purple). The structure is colored from blue to pink from the N to the C terminus. The α/β domain (CATH domain 2) is shown in blue (residues 23–190) and yellow (residues 290–340), whereas the mainly β domain (CATH domain 1), which includes the solvent-exposed RCL (residues 341–361), is shown in green (residues 191–290), purple (RCL), and pink (residues 362–394). Spontaneous insertion of the RCL into sheet A remodels the domains, adding the RCL to the α/β domain, resulting in the lower-free-energy inactive latent state (PDB entry 1IZ2 (39)), and the latency transition is important for regulating the activity of some serpins (36). Cleavage of the RCL by target serine and cysteine proteases results in the formation of an acyl enzyme bond between the protease active site and the RCL, cleavage of the RCL, and insertion of the cleaved RCL into sheet A translocating the covalently attached protease 70 Å from one pole of the serpin to the other as shown by the structure of the kinetically trapped trypsin-AAT inhibitory complex (PDB entry 1EZX (80)). Trypsin is in gray with the catalytic triad in red. Ser-195 in the trypsin catalytic triad and AAT Met-358, which form the intermolecular bond, are shown in red and purple spacefill, respectively. The N-terminal 22–23 residues in AAT lack electron density in the X-ray crystal structures, indicating that the extreme N terminus is disordered.
Figure 5.
Figure 5.
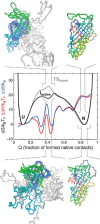
Comparison of the folding free energy profiles (FEP) calculated at their respective folding temperatures (Tf) using the SBMs of active and latent AAT structures. Simulations were performed using replica exchange umbrella sampling (see Ref. for further details). The FEP, the change in Gibbs free energy relative to the thermal energy at the folding temperature, ΔG/kBTf, as a function of the fraction of formed native contacts, Q, for latent and active AAT are plotted in gray and black, respectively. The native ensembles, N, are at Q ≈ 0.84; the transition state ensemble of latent AAT, TSlatent, and the intermediate ensemble, Iactive, of active AAT are at Q ≈ 0.4; and the unfolded ensembles, U, are at Q ≈ 0.1. The relative changes in enthalpy, ΔΔH (active minus latent), and entropy ΔΔS (active minus latent), between the folding of active and latent AAT, plotted versus Q are shown in red and blue, respectively. ΔΔS at Q ≈ 0.4 is higher than ΔΔH at Q ≈ 0.4. Aligned representative structures from the intermediate ensembles are shown with the N-terminal unfolded regions shown in gray. Folded structures (active: PDB entry 1QLP (88); latent: PDB entry 1IZ2 (39)) are also shown with the same coloring as the intermediate structures (N→C-terminal: red through green to blue). The C-terminal region and the RCL are structured in both TSlatent and Iactive. The FEP graph was adapted from Giri Rao and Gosavi (30). This research was originally published in Proceedings of the National Academy of Sciences U.S.A. Giri Rao, V. V. H., and Gosavi, S. On the folding of a structurally complex protein to its metastable active state. Proc. Natl. Acad. Sci. U.S.A. 2018; 115:1998–2003. © National Academy of Sciences.
Figure 6.
Figure 6.
WT and Z AAT BF folding results. Shown are kinetic free energy landscapes from least biased trajectories plotted as the root mean square deviation from the metastable active X-ray crystal structure (PDB entry 1QLP (88)) versus the fraction of native contacts, Q. The heat map is colored by the number of frames. A random sampling of the conformational ensembles from highly populated local minima 2 and 5 for WT and Z is shown with one randomly chosen colored conformation. The landscapes and conformational ensembles show that, within the simulated time interval, WT AAT does fold to the native conformation (local minimum 5) in some of the trajectories. Compared with the WT trajectories, Z begins misfolding at low Q (e.g. the conformational ensemble from local minimum 2), and even the conformations in local minimum 5 are not fully folded. Adapted from Wang et al. (31). This research was originally published in Biophysical Journal. Wang, F., Orioli, S., Ianeselli, A., Spagnolli, G., a Beccara, S., Gershenson, A., Faccioli, P., and Wintrode, P. L. All-atom simulations reveal how single-point mutations promote serpin misfolding. Biophys. J. 2018; 114:2083–2094. © American Society for Biochemistry and Molecular Biology.
Figure 7.
Figure 7.
Domain structures and connectivities for DPO4, DHFR, AKE, and Suf1. A, DPO4 with the finger (light blue), palm (N-terminal strand in blue and the rest in green), thumb (gold), and little finger (pink) domains (PDB entry 2RDI (115)). Domain assignments are from CATH (89). B, DHFR showing the discontinuous DLD (blue and pink) and the continuous ABD (gold) domains (PDB entry 1RX1 (116)). The domain assignments are from Inanami et al. (28). C, AKE showing the discontinuous CORE domain (blue, green, and pink) and the two continuous insertions, NMP (light blue) and Lid (gold) (PDB entry 4AKE (117)). The domain assignments are from Giri Rao and Gosavi (25). D, SufI showing the three sequential domains as assigned by CATH (89) (PDB entry 2UXT (118)). There are missing loops in the M domain. All structures are colored from the N terminus in blue to the C terminus in pink. Nonsequential, discontinuous domains are multicolored.

References

    1. Onuchic J. N., Luthey-Schulten Z., and Wolynes P. G. (1997) Theory of protein folding: the energy landscape perspective. Annu. Rev. Phys. Chem. 48, 545–600 10.1146/annurev.physchem.48.1.545 - DOI - PubMed
    1. Dill K. A., and MacCallum J. L. (2012) The protein-folding problem, 50 years on. Science 338, 1042–1046 10.1126/science.1219021 - DOI - PubMed
    1. Gruebele M., Dave K., and Sukenik S. (2016) Globular protein folding in vitro and in vivo. Annu. Rev. Biophys. 45, 233–251 10.1146/annurev-biophys-062215-011236 - DOI - PubMed
    1. Hebert D. N., and Molinari M. (2007) In and out of the ER: protein folding, quality control, degradation, and related human diseases. Physiol. Rev. 87, 1377–1408 10.1152/physrev.00050.2006 - DOI - PubMed
    1. Hartl F. U., and Hayer-Hartl M. (2009) Converging concepts of protein folding in vitro and in vivo. Nat. Struct. Mol. Biol. 16, 574–581 10.1038/nsmb.1591 - DOI - PubMed

Publication types

LinkOut - more resources