Randomized Controlled Trial
. 2020 Feb;69(2):181-192.
doi: 10.2337/db19-0719. Epub 2019 Nov 11.

Impaired Metabolic Flexibility to High-Fat Overfeeding Predicts Future Weight Gain in Healthy Adults

Affiliations
Randomized Controlled Trial

Impaired Metabolic Flexibility to High-Fat Overfeeding Predicts Future Weight Gain in Healthy Adults

Brittany Begaye et al. Diabetes. 2020 Feb.

Erratum in

Abstract

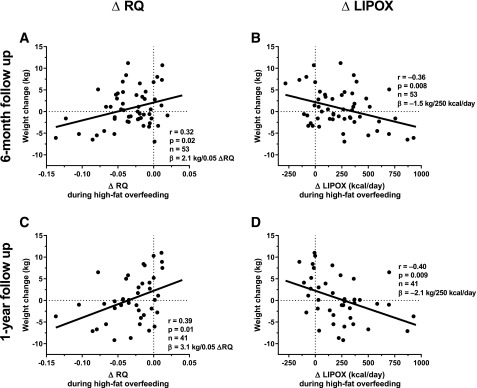
The ability to switch fuels for oxidation in response to changes in macronutrient composition of diet (metabolic flexibility) may be informative of individuals' susceptibility to weight gain. Seventy-nine healthy, weight-stable participants underwent 24-h assessments of energy expenditure and respiratory quotient (RQ) in a whole-room calorimeter during energy balance (EBL) (50% carbohydrate, 30% fat) and then during 24-h fasting and three 200% overfeeding diets in a crossover design. Metabolic flexibility was defined as the change in 24-h RQ from EBL during fasting and standard overfeeding (STOF) (50% carbohydrate, 30% fat), high-fat overfeeding (HFOF) (60% fat, 20% carbohydrate), and high-carbohydrate overfeeding (HCOF) (75% carbohydrate, 5% fat) diets. Free-living weight change was assessed after 6 and 12 months. Compared with EBL, RQ decreased on average by 9% during fasting and by 4% during HFOF but increased by 4% during STOF and by 8% during HCOF. A smaller decrease in RQ, reflecting a smaller increase in lipid oxidation rate, during HFOF but not during the other diets predicted greater weight gain at both 6 and 12 months. An impaired metabolic flexibility to acute HFOF can identify individuals prone to weight gain, indicating that an individual's capacity to oxidize dietary fat is a metabolic determinant of weight change.

Trial registration: ClinicalTrials.gov NCT00523627.


Figures

Figure 1
Figure 1
Twenty-four-hour time courses of RQ during dietary interventions. The average time course of RQ over 24 h is plotted for each dietary intervention: eucaloric standard diet in EBL (50% carbohydrate and 30% fat), 24-h fasting (FST), HFOF (20% carbohydrate and 60% fat), STOF (50% carbohydrate and 30% fat), and HCOF (75% carbohydrate and 5% fat). The three meals provided inside the metabolic chamber were lunch at 1100 h, dinner at 1600 h, and snack at 1900 h. The total caloric intake of the overfeeding diets was equal to twice the 24-h EE value obtained during EBL.
Figure 2
Figure 2
Measures of 24-h RQ and substrate oxidation rates during dietary interventions. Error bars represent the mean ± SD in each dietary condition. The 24-h RQ (A) is shown during each dietary intervention. Red circles indicate “carbohydrate oxidizers”: the five individuals with the highest 24-h RQ during EBL and standard eucaloric feeding. Blue circles indicate “fat oxidizers”: the five individuals with the lowest 24-h RQ during EBL. These same two groups of individuals are subsequently highlighted during each intervention: 24-h fasting (FST), STOF, HFOF, and HCOF, where the carbohydrate oxidizers remained above the mean 24-h RQ during each intervention and the fat oxidizers remained below the mean 24-h RQ despite being challenged with overfeeding. The determinants of 24-h RQ (B) are shown where two-thirds of the total variance of RQ measurements is explained by diet, one-fifth of RQ is explained by intrinsic factors, and the remaining variance (12%) is explained by other unmeasured factors. The substrate oxidation rates LIPOX (C) and CARBOX (D) are shown during each dietary intervention, where the red dots signify carbohydrate oxidizers during each dietary intervention, and these remained on the lower end during LIPOX and the upper end during CARBOX. Similarly, the fat oxidizers in blue remained on the upper end for LIPOX and were on the lower end of the spectrum during CARBOX.
Figure 3
Figure 3
Metabolic flexibility (ΔRQ) and changes in substrate oxidation rates during dietary interventions. Relationships (±95% CI) between 24-h RQ during each diet and 24-h RQ during EBL (A) and individual changes in 24-h RQ (ΔRQ, metabolic flexibility) from EBL (B) are shown. Individual changes in LIPOX (C) and CARBOX (D) rates also are shown.
Figure 4
Figure 4
Relationships between fasting plasma NEFA concentrations and 24-h RQ and LIPOX. Inverse relationships between fasting plasma NEFAs and 24-h RQ during EBL (A) and HFOF (B) and direct relationships between fasting plasma NEFAs and 24-h LIPOX during EBL (C) and HFOF (D) are shown. Relationships were quantified by the Pearson correlation coefficient. Effect size estimates (β-coefficient) were obtained through linear regression analysis.
Figure 5
Figure 5
Metabolic flexibility (ΔRQ) during HFOF predicts future weight change. The ΔRQ (metabolic flexibility) from EBL during HFOF predicted future weight change at 6 months (A) and 1 year (C); that is, a smaller (or lack of) decrease in RQ during HFOF was associated with greater weight gain. The change in 24-h LIPOX from EBL conditions was inversely associated with weight gain at 6 months (B) and 1 year (D), such that an impaired shift to LIPOX during HFOF was associated with greater future weight gain. The dotted lines denote no changes in 24-h RQ, LIPOX, or body weight at follow-up visits compared with the baseline visit. Relationships were quantified by the Pearson correlation coefficient. Effect size estimates (β-coefficient) were obtained via linear regression analysis.

References

    1. Bouchard C, Tremblay A, Després JP, et al. . The response to long-term overfeeding in identical twins. N Engl J Med 1990;322:1477–1482 - PubMed
    1. Diaz EO, Prentice AM, Goldberg GR, Murgatroyd PR, Coward WA. Metabolic response to experimental overfeeding in lean and overweight healthy volunteers. Am J Clin Nutr 1992;56:641–655 - PubMed
    1. Reinhardt M, Thearle MS, Ibrahim M, et al. . A human thrifty phenotype associated with less weight loss during caloric restriction. Diabetes 2015;64:2859–2867 - PMC - PubMed
    1. Leibel RL, Rosenbaum M, Hirsch J. Changes in energy expenditure resulting from altered body weight. N Engl J Med 1995;332:621–628 - PubMed
    1. Piaggi P. Metabolic determinants of weight gain in humans. Obesity (Silver Spring) 2019;27:691–699 - PMC - PubMed

Publication types

Associated data