Comparative Study
. 2019 Nov 19;116(47):23618-23624.
doi: 10.1073/pnas.1912409116. Epub 2019 Nov 11.

The in vivo endothelial cell translatome is highly heterogeneous across vascular beds

Affiliations
Comparative Study

The in vivo endothelial cell translatome is highly heterogeneous across vascular beds

Audrey C A Cleuren et al. Proc Natl Acad Sci U S A. .

Abstract

Endothelial cells (ECs) are highly specialized across vascular beds. However, given their interspersed anatomic distribution, comprehensive characterization of the molecular basis for this heterogeneity in vivo has been limited. By applying endothelial-specific translating ribosome affinity purification (EC-TRAP) combined with high-throughput RNA sequencing analysis, we identified pan EC-enriched genes and tissue-specific EC transcripts, which include both established markers and genes previously unappreciated for their presence in ECs. In addition, EC-TRAP limits changes in gene expression after EC isolation and in vitro expansion, as well as rapid vascular bed-specific shifts in EC gene expression profiles as a result of the enzymatic tissue dissociation required to generate single-cell suspensions for fluorescence-activated cell sorting or single-cell RNA sequencing analysis. Comparison of our EC-TRAP with published single-cell RNA sequencing data further demonstrates considerably greater sensitivity of EC-TRAP for the detection of low abundant transcripts. Application of EC-TRAP to examine the in vivo host response to lipopolysaccharide (LPS) revealed the induction of gene expression programs associated with a native defense response, with marked differences across vascular beds. Furthermore, comparative analysis of whole-tissue and TRAP-selected mRNAs identified LPS-induced differences that would not have been detected by whole-tissue analysis alone. Together, these data provide a resource for the analysis of EC-specific gene expression programs across heterogeneous vascular beds under both physiologic and pathologic conditions.

Keywords: RNA sequencing; endothelial cell; gene expression.


Conflict of interest statement

The authors declare no competing interest.

Figures

Fig. 1.
Fig. 1.
PCA of expression profiles from primary EC of wild-type heart and kidney capillaries obtained immediately after isolation (day 0) identified 4,783 differentially expressed genes (FDR < 10%) between tissue origins. In vitro expansion for 3 d resulted in significant shifts in expression programs, with the number of differentially expressed genes being reduced to 2,397 between heart and kidney ECs, indicating phenotypic drift occurring in the absence of a native microenvironment; n = 3 biologic replicates per condition.
Fig. 2.
Fig. 2.
In vivo targeting of Tek-positive cells to determine tissue-specific EC content. (AD) Histologic analysis of RosamT/mG,Tek-Cre+/0 brain (A), heart (B), kidney (C), and liver (D) sections. Tek-positive cells are identified by the expression of membrane-bound green fluorescent protein, whereas Tek-negative cells express membrane-bound Tomato red fluorescent protein. (Scale bar, 25 µm.) (E) Percentage of Tek-positive cells as a proxy for EC content in each tissue, determined by high-throughput DNA sequencing of Rpl22 isoforms in tissues from Rpl22fl/fl, Tek-Cre+/0 animals; n = 5 biologic replicates (mean ± SD).
Fig. 3.
Fig. 3.
Evaluation of transcriptome vs. translatome data after (EC) TRAP. (A) PCA of transcriptome vs. translatome data from 10-wk-old Rpl22fl/fl, EIIa-Cre+/0 male mice shows only minor differences between tissue-specific mRNA pools from brain, heart, kidney, liver, and lung, whereas (B) EC translatomes obtained after TRAP from Rpl22fl/fl, Tek-Cre+/0 tissues are highly distinct from the unselected tissue transcriptomes, with the exception of lung. n = 3 biologic replicates per tissue.
Fig. 4.
Fig. 4.
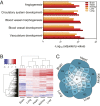
Identification of enriched transcripts after EC-TRAP. (A) GO analysis of the 500 top-ranked genes with the highest enrichment scores after EC-TRAP (FDR < 10%) shows overrepresentation of transcripts involved in vascular-related processes. (B) Unsupervised hierarchical clustering of EC-enriched genes (enrichment score >2 in at least 1 tissue) shows distinct, highly heterogeneous vascular bed-specific EC expression patterns. (C) Comparison of the top 500 most enriched genes per tissue identifies a group of pan-endothelial and subsets of tissue-specific EC-enriched genes. Data based on n = 3 biologic replicates per tissue.
Fig. 5.
Fig. 5.
Single-molecule in situ hybridization validates EC-enriched transcripts identified by TRAP. (A and B) Colocalization of Bvht and Eva1b, both identified as pan-EC markers by EC-TRAP, with Tek by in situ hybridization in kidney, brain, and liver sections. (C and D) 3110099E03Rik (Rik) and Wnt9b were identified as kidney- and liver-specific EC markers, respectively, and were only present in the corresponding tissues, where they also colocalized with Tek, confirming their EC origin. (Insets) Dotted lines outline the cell nuclei as indicated by DAPI counterstaining. (Scale bars, 10 µm in overviews [left column in each panel] and 2.5 µm in Insets [remaining columns]).
Fig. 6.
Fig. 6.
Dissociation-induced changes in EC gene expression programs. (A) PCA analysis of brain, kidney, and liver EC translatomes obtained from TRAP samples after cycloheximide perfusion and mechanical dissociation vs. samples after enzymatic tissue dissociation without cycloheximide perfusion. (B) mRNA abundance based on log2(TPM) values, and presented as a yellow (low abundance) to blue (high abundance) gradient, shows clustering of brain and liver EC translatomes by preparation method rather than by tissue type. Data from n = 3 biologic replicates per tissue.
Fig. 7.
Fig. 7.
In vivo LPS-induced changes uncovered by EC-TRAP. (A and B) Volcano plots indicate genes significantly affected 4 h after LPS exposure (red), either for tissue transcriptomes (A) or in the EC translatome as identified by EC-TRAP (B). The horizontal dotted lines mark an FDR cutoff <10%, with the vertical dotted lines denoting log2 fold changes of >1 or <−1. Data averaged from n = 3 biologic replicates per tissue.

References

    1. Aird W. C., Phenotypic heterogeneity of the endothelium: II. Representative vascular beds. Circ. Res. 100, 174–190 (2007). - PubMed
    1. Potente M., Mäkinen T., Vascular heterogeneity and specialization in development and disease. Nat. Rev. Mol. Cell Biol. 18, 477–494 (2017). - PubMed
    1. Ribatti D., Nico B., Vacca A., Roncali L., Dammacco F., Endothelial cell heterogeneity and organ specificity. J. Hematother. Stem Cell Res. 11, 81–90 (2002). - PubMed
    1. Atkins G. B., Jain M. K., Hamik A., Endothelial differentiation: Molecular mechanisms of specification and heterogeneity. Arterioscler. Thromb. Vasc. Biol. 31, 1476–1484 (2011). - PMC - PubMed
    1. McCarron J. G., et al. , Heterogeneity and emergent behaviour in the vascular endothelium. Curr. Opin. Pharmacol. 45, 23–32 (2019). - PMC - PubMed

Publication types

MeSH terms