. 2019 Nov 26;116(48):24268-24274.
doi: 10.1073/pnas.1909865116. Epub 2019 Nov 11.

An open challenge to advance probabilistic forecasting for dengue epidemics

Michael A Johansson  1   2 Karyn M Apfeldorf  3 Scott Dobson  3 Jason Devita  3 Anna L Buczak  4 Benjamin Baugher  4 Linda J Moniz  4 Thomas Bagley  4 Steven M Babin  4 Erhan Guven  4 Teresa K Yamana  5 Jeffrey Shaman  5 Terry Moschou  6 Nick Lothian  6 Aaron Lane  6 Grant Osborne  6 Gao Jiang  7 Logan C Brooks  8 David C Farrow  8 Sangwon Hyun  9 Ryan J Tibshirani  8   9 Roni Rosenfeld  8 Justin Lessler  10 Nicholas G Reich  11 Derek A T Cummings  12   13 Stephen A Lauer  11 Sean M Moore  14   15 Hannah E Clapham  16 Rachel Lowe  17   18 Trevor C Bailey  19 Markel García-Díez  20 Marilia Sá Carvalho  21 Xavier Rodó  18   22 Tridip Sardar  22 Richard Paul  23   24 Evan L Ray  25 Krzysztof Sakrejda  11 Alexandria C Brown  11 Xi Meng  11 Osonde Osoba  26 Raffaele Vardavas  26 David Manheim  27 Melinda Moore  26 Dhananjai M Rao  28 Travis C Porco  29 Sarah Ackley  29 Fengchen Liu  29 Lee Worden  29 Matteo Convertino  30 Yang Liu  31 Abraham Reddy  31 Eloy Ortiz  32 Jorge Rivero  32 Humberto Brito  32   33 Alicia Juarrero  32   34 Leah R Johnson  35 Robert B Gramacy  36 Jeremy M Cohen  36 Erin A Mordecai  37 Courtney C Murdock  38   39 Jason R Rohr  14   15 Sadie J Ryan  13   40   41 Anna M Stewart-Ibarra  42 Daniel P Weikel  43 Antarpreet Jutla  44 Rakibul Khan  44 Marissa Poultney  44 Rita R Colwell  45 Brenda Rivera-García  46 Christopher M Barker  47 Jesse E Bell  48 Matthew Biggerstaff  49 David Swerdlow  49 Luis Mier-Y-Teran-Romero  50   10 Brett M Forshey  51 Juli Trtanj  52 Jason Asher  53 Matt Clay  53 Harold S Margolis  50 Andrew M Hebbeler  54   55 Dylan George  55   56 Jean-Paul Chretien  55   57
Affiliations

An open challenge to advance probabilistic forecasting for dengue epidemics

Michael A Johansson et al. Proc Natl Acad Sci U S A. .

Erratum in

Abstract

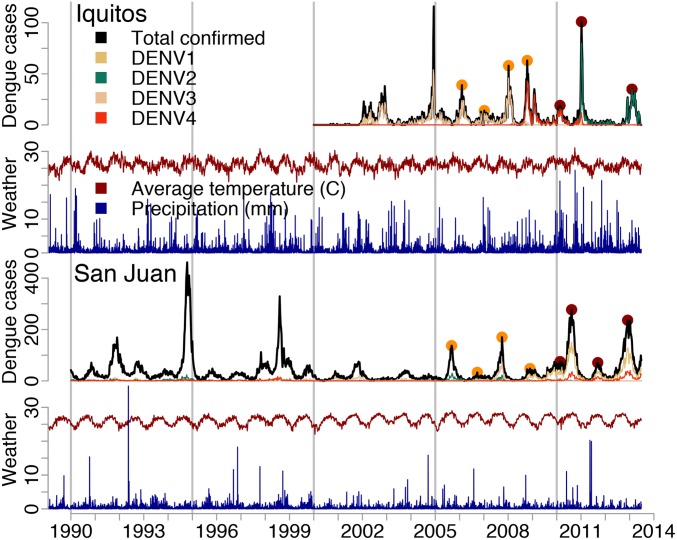
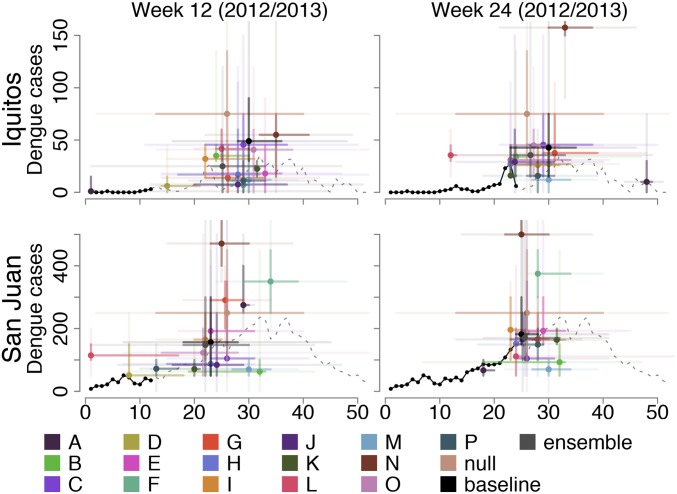
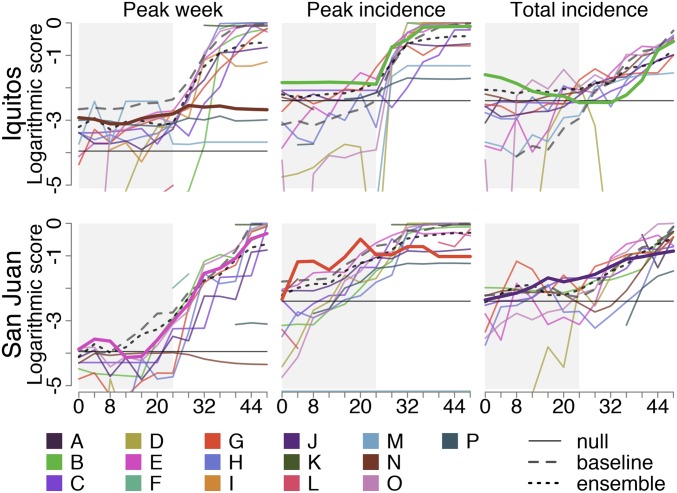
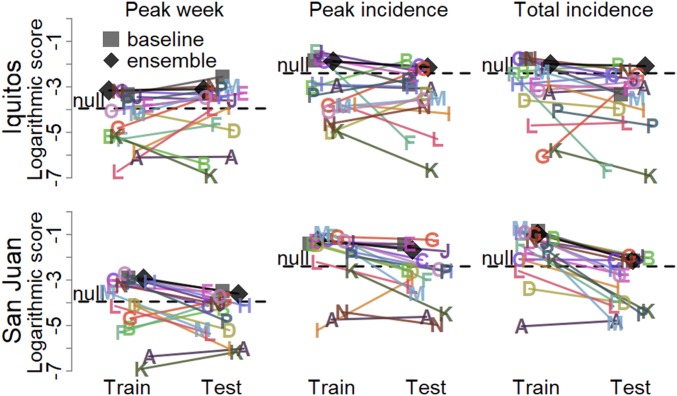
A wide range of research has promised new tools for forecasting infectious disease dynamics, but little of that research is currently being applied in practice, because tools do not address key public health needs, do not produce probabilistic forecasts, have not been evaluated on external data, or do not provide sufficient forecast skill to be useful. We developed an open collaborative forecasting challenge to assess probabilistic forecasts for seasonal epidemics of dengue, a major global public health problem. Sixteen teams used a variety of methods and data to generate forecasts for 3 epidemiological targets (peak incidence, the week of the peak, and total incidence) over 8 dengue seasons in Iquitos, Peru and San Juan, Puerto Rico. Forecast skill was highly variable across teams and targets. While numerous forecasts showed high skill for midseason situational awareness, early season skill was low, and skill was generally lowest for high incidence seasons, those for which forecasts would be most valuable. A comparison of modeling approaches revealed that average forecast skill was lower for models including biologically meaningful data and mechanisms and that both multimodel and multiteam ensemble forecasts consistently outperformed individual model forecasts. Leveraging these insights, data, and the forecasting framework will be critical to improve forecast skill and the application of forecasts in real time for epidemic preparedness and response. Moreover, key components of this project-integration with public health needs, a common forecasting framework, shared and standardized data, and open participation-can help advance infectious disease forecasting beyond dengue.

Keywords: Peru; Puerto Rico; dengue; epidemic; forecast.


Conflict of interest statement

The authors declare no competing interest.

Figures

Fig. 1.
Fig. 1.
Dengue and climate data for Iquitos, Peru and San Juan, Puerto Rico. The black and colored lines for dengue cases indicate the total and virus-specific weekly number of laboratory-confirmed cases. The yellow and red points indicate the peaks in the training and testing datasets, respectively. The climate data show the weekly rainfall (blue) and mean temperature (red) for Iquitos and San Juan, respectively, from the National Centers for Environmental Prediction Climate Forecast System Reanalysis.
Fig. 2.
Fig. 2.
Weeks 12 and 24 forecasts for the 2012/2013 dengue season in Iquitos and San Juan. The solid black lines indicate the most recent data that were available to teams to inform these forecasts, and the dashed lines indicate the data that became available later in the season. The colored points represent point estimates for each team, while the bars represent 50 and 95% prediction intervals (dark and light, respectively). Forecasts for additional time points and seasons as well as for seasonal incidence are shown in SI Appendix, Figs. S1 and S2, respectively.
Fig. 3.
Fig. 3.
Forecast skill by team, forecast week, and target in the testing seasons (2009/2010 to 2012/2013). Solid colored lines represent the scores of individual teams averaged across all testing seasons for the respective forecast week, target, and location. For each target, the top forecast for the first 24 wk (shaded) is indicated in bold (highest average early season score). The solid black lines indicate the null model (equal probability assigned to all possible outcomes), the dashed gray lines indicate the baseline model, and the dotted black lines indicate the ensemble model. Forecasts with logarithmic scores of less than −5 are not shown. Breaks in lines indicate a score of negative infinity in at least 1 of the testing seasons.
Fig. 4.
Fig. 4.
Overall forecast scores for weeks 0 to 24 in the training (2005/2006 to 2008/2009) and testing (2009/2010 to 2012/2013) seasons. Each point is the average target- and location-specific log score for a model in the training (left side; light shading) and testing (right side; dark shading) seasons. The horizontal dispersion within training and testing scores is random to improve visualization. The null forecast for each target is represented by a horizontal line. Numerous forecasts assigned 0 probability to at least 1 observed outcome. Those individual forecast probabilities were changed to 0.001 before calculating the logarithmic scores.

References

    1. Bhatt S., et al. , The global distribution and burden of dengue. Nature 496, 504–507 (2013). - PMC - PubMed
    1. Johansson M. A., Cummings D. A., Glass G. E., Multiyear climate variability and dengue–El Niño southern oscillation, weather, and dengue incidence in Puerto Rico, Mexico, and Thailand: A longitudinal data analysis. PLoS Med. 6, e1000168 (2009). - PMC - PubMed
    1. van Panhuis W. G., et al. , Region-wide synchrony and traveling waves of dengue across eight countries in Southeast Asia. Proc. Natl. Acad. Sci. U.S.A. 112, 13069–13074 (2015). - PMC - PubMed
    1. Constenla D., Garcia C., Lefcourt N., Assessing the economics of dengue: Results from a systematic review of the literature and expert survey. Pharmacoeconomics 33, 1107–1135 (2015). - PubMed
    1. Shepard D. S., Undurraga E. A., Halasa Y. A., Stanaway J. D., The global economic burden of dengue: A systematic analysis. Lancet Infect. Dis. 16, 935–941 (2016). - PubMed

Publication types