. 2019 Nov 26;116(48):24275-24284.
doi: 10.1073/pnas.1903854116. Epub 2019 Nov 11.

Long-term in vivo microscopy of CAR T cell dynamics during eradication of CNS lymphoma in mice

Affiliations

Long-term in vivo microscopy of CAR T cell dynamics during eradication of CNS lymphoma in mice

Matthias Mulazzani et al. Proc Natl Acad Sci U S A. .

Abstract

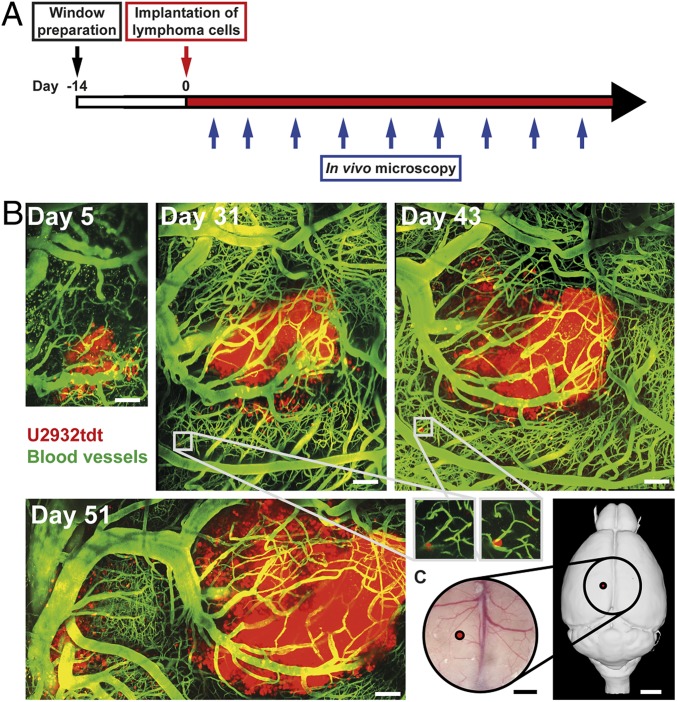
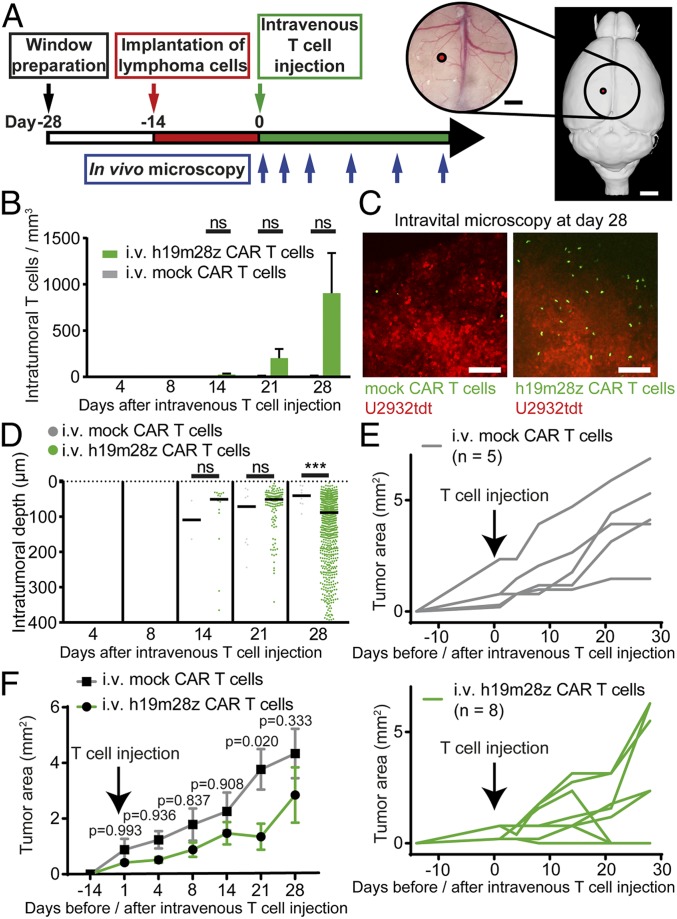
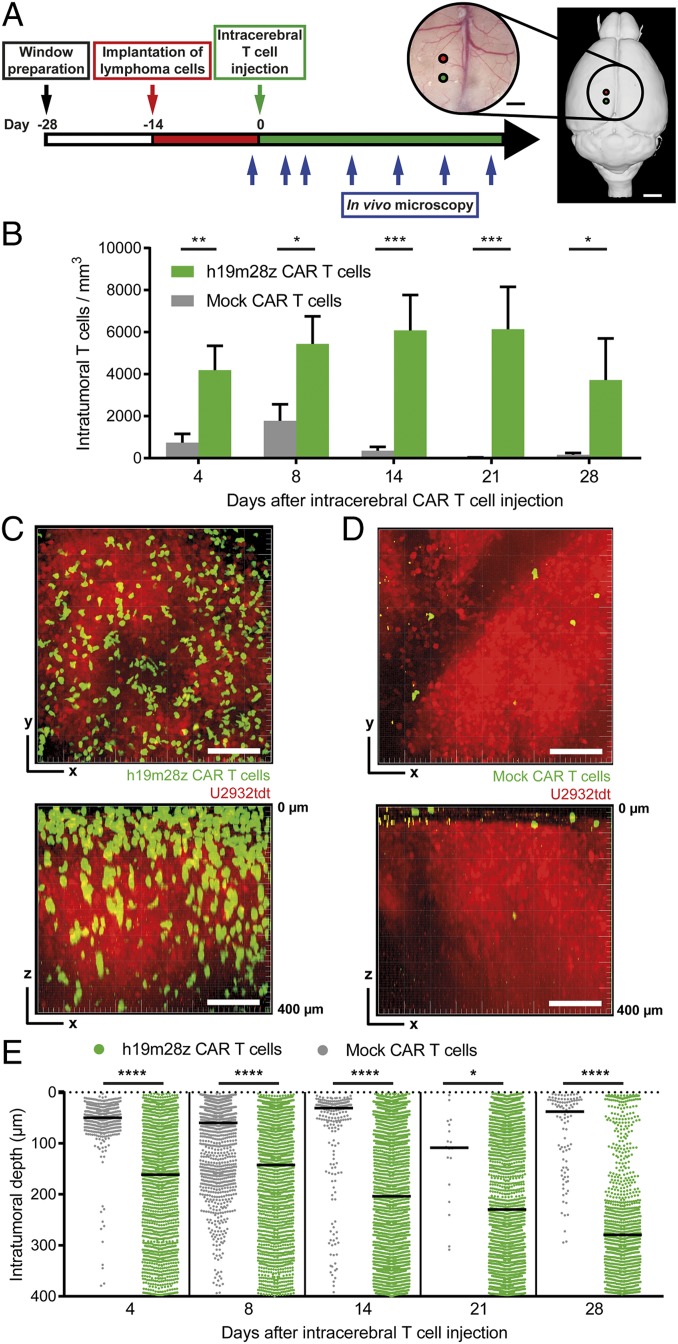
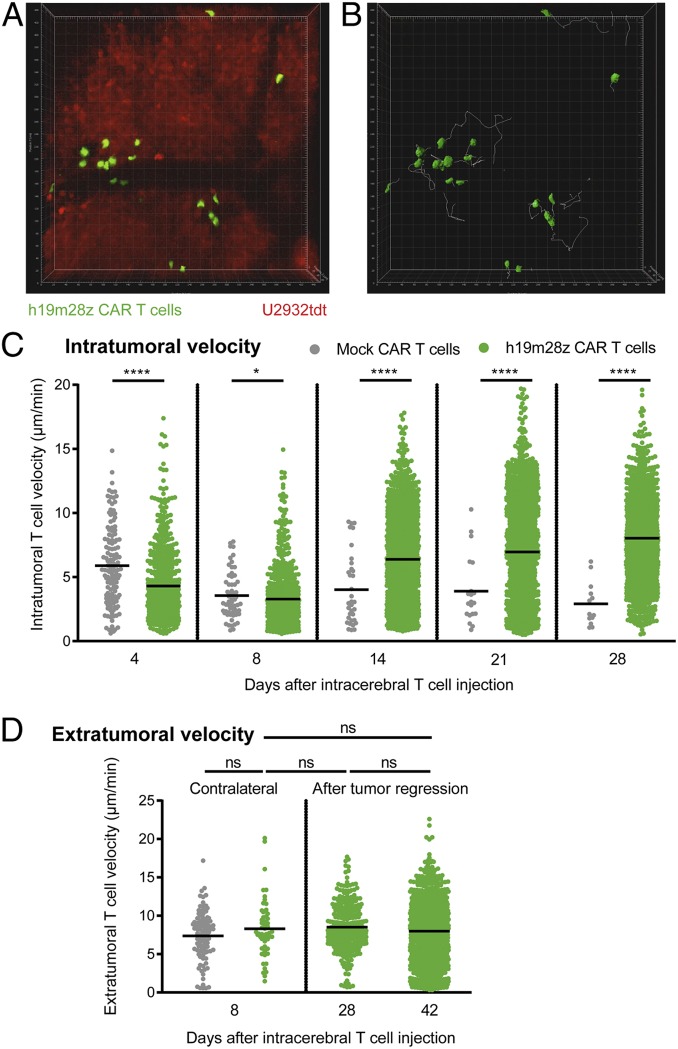
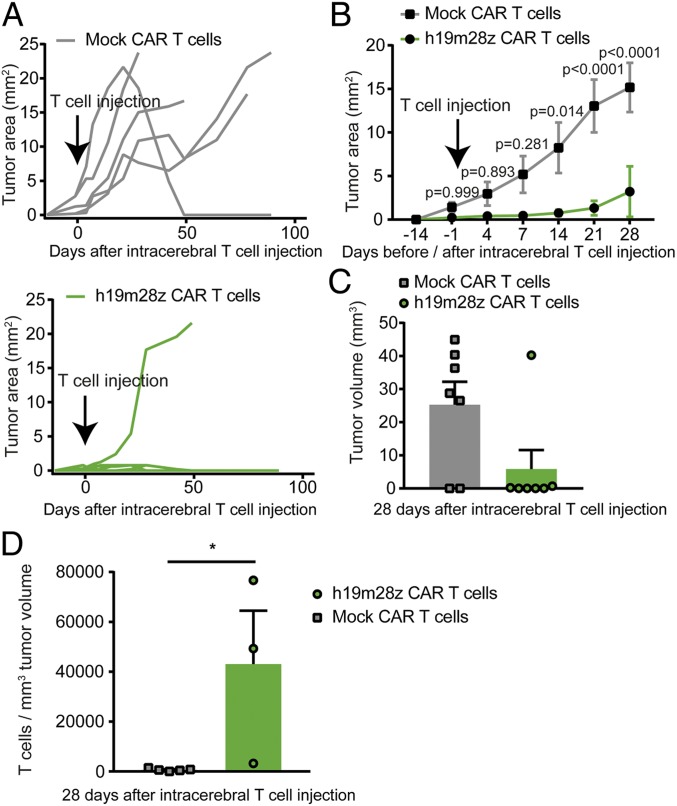
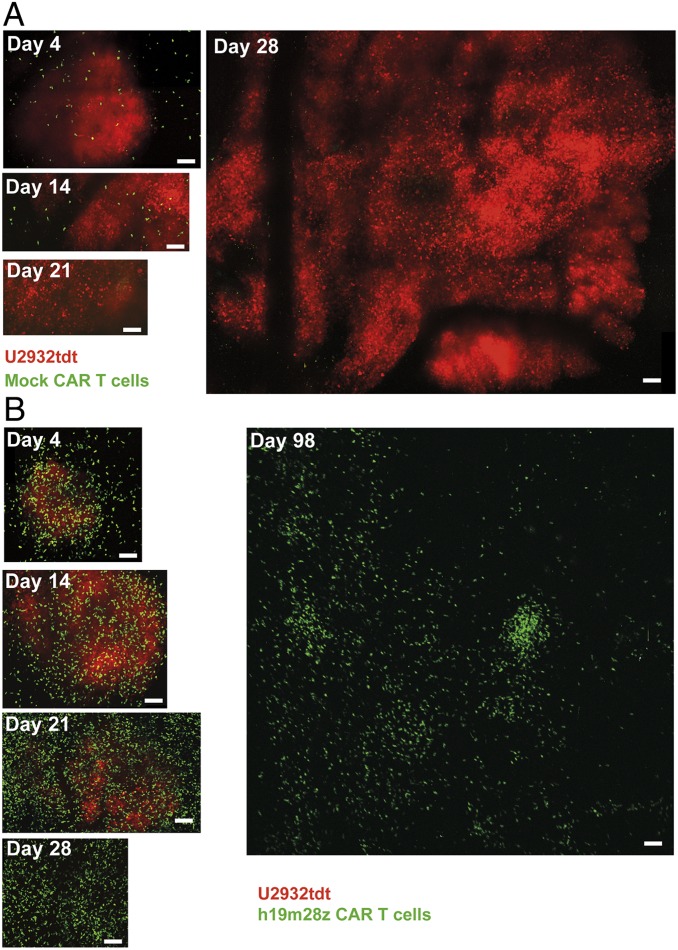
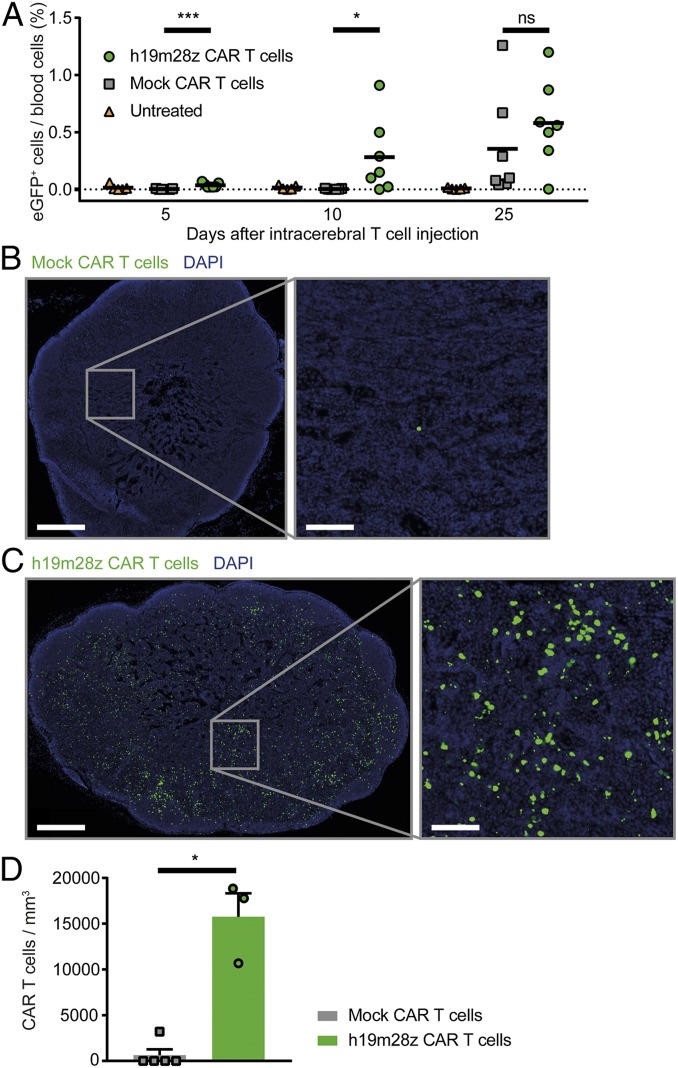
T cells expressing anti-CD19 chimeric antigen receptors (CARs) demonstrate impressive efficacy in the treatment of systemic B cell malignancies, including B cell lymphoma. However, their effect on primary central nervous system lymphoma (PCNSL) is unknown. Additionally, the detailed cellular dynamics of CAR T cells during their antitumor reaction remain unclear, including their intratumoral infiltration depth, mobility, and persistence. Studying these processes in detail requires repeated intravital imaging of precisely defined tumor regions during weeks of tumor growth and regression. Here, we have combined a model of PCNSL with in vivo intracerebral 2-photon microscopy. Thereby, we were able to visualize intracranial PCNSL growth and therapeutic effects of CAR T cells longitudinally in the same animal over several weeks. Intravenous (i.v.) injection resulted in poor tumor infiltration of anti-CD19 CAR T cells and could not sufficiently control tumor growth. After intracerebral injection, however, anti-CD19 CAR T cells invaded deeply into the solid tumor, reduced tumor growth, and induced regression of PCNSL, which was associated with long-term survival. Intracerebral anti-CD19 CAR T cells entered the circulation and infiltrated distant, nondraining lymph nodes more efficiently than mock CAR T cells. After complete regression of tumors, anti-CD19 CAR T cells remained detectable intracranially and intravascularly for up to 159 d. Collectively, these results demonstrate the great potential of anti-CD19 CAR T cells for the treatment of PCNSL.

Keywords: 2-photon microscopy; CAR T cells; PCNSL; tumor immunology.


Conflict of interest statement

Competing interest statement: S.P.F., I.v.M.-H., S.L., X.Z., H.I.-A., J.L., W.Z., S.D., M.S., M.R., A.S., V.R.B., and L.v.B. declare that they have no competing interests. M.M. has been a member of a scientific advisory committee for Gilead. M.D. has been a member of a scientific advisory committee for Novartis. M.v.B.-B. received research funding from Miltenyi Biotech and Novartis and honoraria from Kite/Gilead. D.H.B. is cofounder of STAGE cell therapeutics GmbH (now Juno Therapeutics/Celgene) and T Cell Factory B.V. (now Kite/Gilead). D.H.B. has a consulting contract with and receives sponsored research support from Juno Therapeutics. The authors have no additional financial interests.

Figures

Fig. 1.
Fig. 1.
Characteristic pattern of PCNSL growth repeatedly visualized with in vivo TPLSM. (A) Schematic representation illustrating experimental design. (B) Intracerebral tumor growth after stereotactic implantation of U2932tdt cells (red). Blood vessels are highlighted after i.v. injection of FITC-dextran (green). Images represent mosaics of multiple maximum intensity projections. Insets show perivascular, dormant tumor cells. Representative mosaics of 15 mice from 8 independent experiments. (Scale bars: 100 µm.) (C) Position of tumor implantation (red) and position and dimensions of the chronic cranial window (circle; 6 × 6 mm). (Scale bars: Left, 1 mm; Right, 2 mm.) Right panel created with 3dBAR plugin of the Scalable Brain Atlas (SBA) (–55).
Fig. 2.
Fig. 2.
After i.v. injection, intratumoral h19m28z CAR T cells are present in low numbers without a sustained effect on tumor growth for the majority of treated animals. (A) Schematic representation illustrating experimental design. Right panel created with 3dBAR/SBA (–55). (B) Intratumoral mock or h19m28z CAR T cell numbers after i.v. injection (quantification of 1 to 3 3D ROIs per mouse per time point depending on tumor size). (C) Representative maximum intensity projections illustrating intratumoral mock (Left) and h19m28z CAR T cells (Right) 28 d after i.v. injection. (Scale bars: 100 µm.) (D) Distance of intratumoral CAR T cells from brain surface (pooled data from 1 to 3 3D ROIs per mouse). Each point represents an individual mock or h19m28z CAR T cell. T cell number and position after tumor regression (day 28: 3 of 8 mice in the h19m28z group, 0 of 5 in the mock group) have been excluded. ***P < 0.001. (E and F) Intracerebral, 2D tumor area assessed by in vivo microscopy after mock and h19m28z CAR T cell treatment. Individual (E) and pooled (F) tumor size. (BF) n = 5 and 8 for mock and h19m28z CAR T cell treatment, respectively, from 4 independent experiments. Data are shown as mean + SEM (B) or median (D). Mann–Whitney U test (B and D) or 2-way ANOVA followed by Sidak’s multiple comparisons test (F). ns, not significant.
Fig. 3.
Fig. 3.
After intracerebral injection, intratumoral h19m28z CAR T cells are present at higher numbers and persist longer than mock CAR T cells. (A) Schematic representation illustrating experimental design. Right panel created with 3dBAR/SBA (–55). (B) Intratumoral CAR T cell numbers in mice treated with intracerebral mock or h19m28z CAR T cells. Quantification of 1 to 2 3D ROIs (depending on tumor size) per mouse. n = 4 mice per group from 2 independent experiments. (C and D) Representative maximum intensity projections of axial (xy; Upper) and sagittal (xz; Lower) orientation illustrating intratumoral h19m28z (C) and mock (D) CAR T cells 14 d after CAR T cell injection. (Scale bars: 100 µm.) (E) Distance of intratumoral CAR T cells from brain surface. n = 1 to 2 3D ROIs of 4 mice per group from 2 independent experiments. Each point represents an individual mock or h19m28z CAR T cell. T cell number and position after tumor regression (day 28: 2 of 4 mice in the h19m28z group, 0 of 4 in the mock group) have been excluded. Data are shown as mean + SEM (B) or median (E). Mann–Whitney U test (B and E). ns, not significant. *P < 0.05; **P < 0.01; ***P < 0.001; ****P < 0.0001.
Fig. 4.
Fig. 4.
Initially, intratumoral h19m28z CAR T cells migrate slower than mock CAR T cells in vivo, while extratumoral velocity shows no difference. (A) The 3D TPLSM stack of U2932tdt cells (red) and h19m28z CAR T cells (green) (Movie S3). Representative movie of 4 mice from 2 independent experiments. (B) The 3D reconstruction of CAR T cells (green) and their intratumoral migration tracks (white) during 30 min of a representative time-lapse TPLSM video 4 d after intracerebral CAR T cell injection. (C) Quantification of individual, intratumoral T cell velocities. Each point represents 1 CAR T cell track. Pooled results from time-lapse TPLSM videos of at least 30-min duration (recorded every 30 s) per time point. ROI of 450 × 450 × 66 µm starting at least 100 µm beneath the most superficial tumor compartment. Pooled data from 4 mice per group from 2 independent experiments. (D) Quantification of individual, extratumoral T cell velocities in the ROI contralateral (Left; n = 4 per group) or at tumor injection site after tumor regression (Right; n = 2 for h19m28z CAR T cell-treated mice). Results from 2 independent experiments. Data are shown as mean. Mann–Whitney U test. ns, not significant. *P < 0.05; ****P < 0.0001.
Fig. 5.
Fig. 5.
Intracerebral injection of h19m28z CAR T cell treatment leads to reduced PCNSL growth, more tumor regressions, and a higher number of intratumoral CAR T cells compared with mock CAR T cell treatment. (A and B) Intracerebral, 2D tumor area assessed by in vivo microscopy after mock and h19m28z CAR T cell treatment. Individual (A) and pooled (B) tumor size. Results from 3 independent experiments. (C) Intracranial tumor volume measured via immunofluorescence 28 d after T cell injection in mock or h19m28z CAR T cell-treated mice without cranial window implantation (n = 7 per group from 2 independent experiments). (D) Intratumoral CAR T-cell number per 1 mm3 tumor volume 28 d after intracerebral CAR T cell injection. (A and B) n = 5 and 6 mice for mock and h19m28z CAR T cell-treated mice, respectively. (C and D) n = 7 mice per group from 2 independent experiments. A 2-way ANOVA followed by Sidak’s multiple comparisons test (B) or Mann–Whitney U test (C and D). Data are shown as mean ± SEM (B) or mean + SEM (C and D). *P < 0.05.
Fig. 6.
Fig. 6.
Mock CAR T cells persist less than 3 wk intratumorally, and PCNSL grows unimpededly, while h19m28z CAR T cells eradicate intracerebral U2932tdt cells and persist intracerebrally for more than 14 wk after intracerebral injection. Representative, serial TPLSM images of intracerebral mock CAR T cells (A; green) or h19m28z CAR T cells (B; green) and U2932tdt cells (red). Mosaics of maximum intensity projections with dimensions of 450 × 450 × 400 µm per ROI (until day 28) or 2,387 × 2,387 × 280 µm (day 98) (Movie S5). n = 4 mice per group from 2 independent experiments. (Scale bars: 100 µm.)
Fig. 7.
Fig. 7.
After intracerebral injection, h19m28z CAR T cells intravasate earlier and infiltrate nondraining lymph nodes in higher numbers compared with mock CAR T cells. (A) Fraction of CAR T cells of all leukocytes in blood measured by FACS analysis (eGFP+). Control (orange; n = 5), mock CAR T cells (gray; n = 7), and h19m28z CAR T cells (green; n = 7). Results from 2 independent experiments. (B and C) Representative immunofluorescence images of inguinal lymph nodes (mock [B] or h19m28z [C] CAR T cells [green] and 4′,6-diamidino-2-phenylindole (DAPI) [blue]). (D) Number of CAR T cells in inguinal lymph nodes of mice with intracerebral tumors present 28 d after T cell injection (n = 5 mock and 3 h19m38z CAR T cell-treated mice) (same animals as in Fig. 5D). Results from 2 independent experiments. Mann–Whitney U test. Data are shown as mean (A) and mean + SEM (D). ns, not significant. *P < 0.05; ***P < 0.001.

Comment in

References

    1. Shiels M. S., et al. , Trends in primary central nervous system lymphoma incidence and survival in the U.S. Br. J. Haematol. 174, 417–424 (2016). - PMC - PubMed
    1. Fossard G., et al. , Utility of post-therapy brain surveillance imaging in the detection of primary central nervous system lymphoma relapse. Eur. J. Cancer 72, 12–19 (2017). - PubMed
    1. Ben Abdelwahed Bagga R., et al. , Mouse models of primary central nervous system lymphomas: Tools for basing funding and therapeutic strategies. J. Neurooncol. 121, 9–18 (2015). - PubMed
    1. Fesnak A. D., June C. H., Levine B. L., Engineered T cells: The promise and challenges of cancer immunotherapy. Nat. Rev. Cancer 16, 566–581 (2016). - PMC - PubMed
    1. Porter D. L., et al. , Chimeric antigen receptor T cells persist and induce sustained remissions in relapsed refractory chronic lymphocytic leukemia. Sci. Transl. Med. 7, 303ra139 (2015). - PMC - PubMed

Publication types

MeSH terms