. 2019 Nov 26;116(48):24075-24083.
doi: 10.1073/pnas.1908052116. Epub 2019 Nov 11.

mRNA structure regulates protein expression through changes in functional half-life

Affiliations

mRNA structure regulates protein expression through changes in functional half-life

David M Mauger et al. Proc Natl Acad Sci U S A. .

Abstract

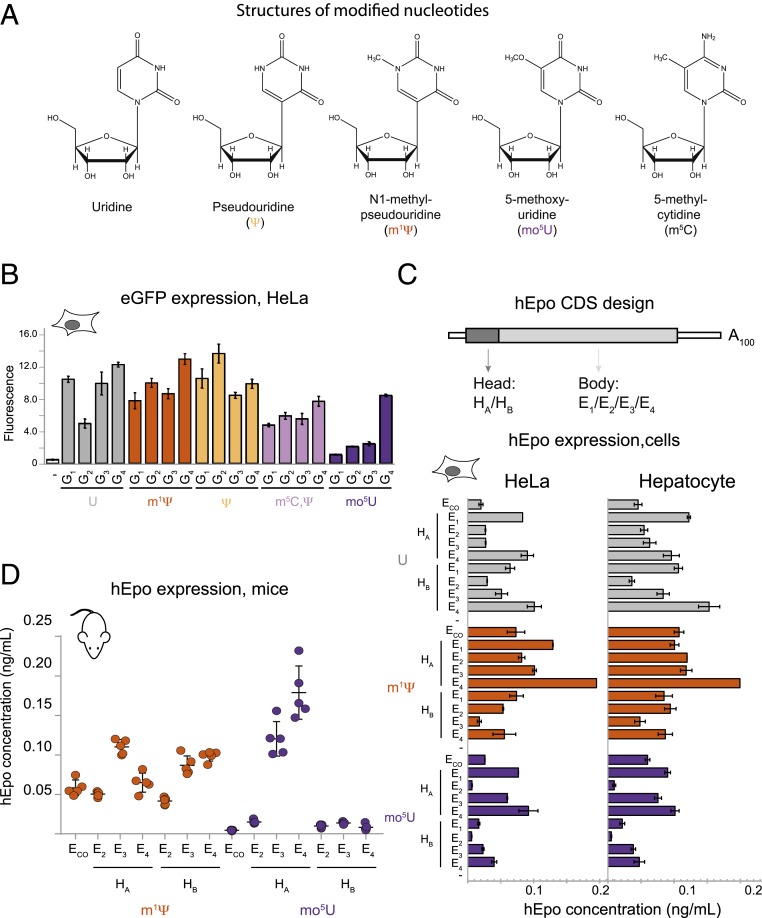
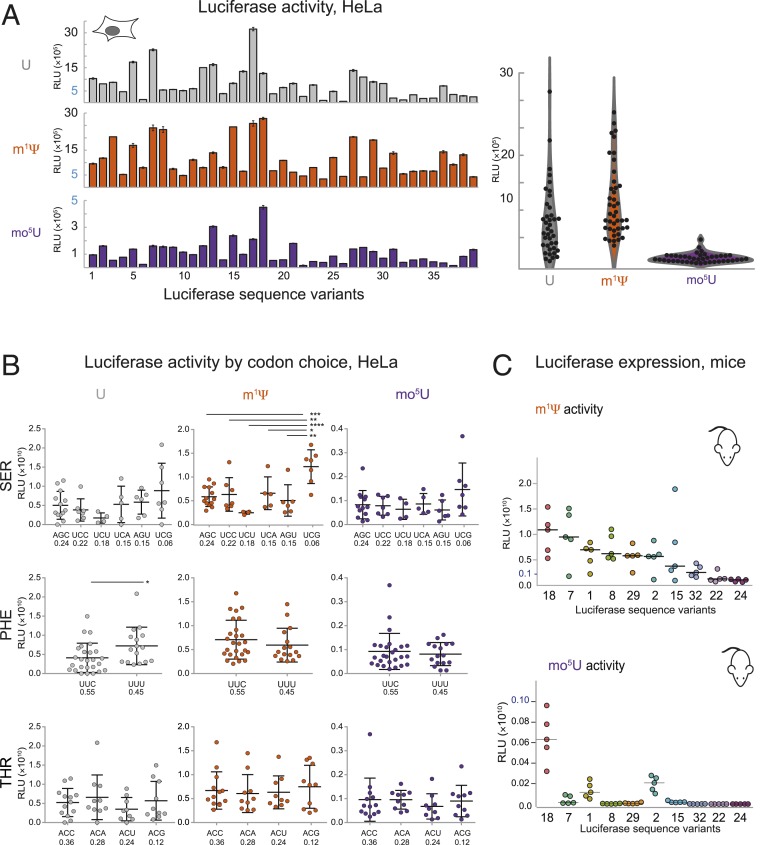
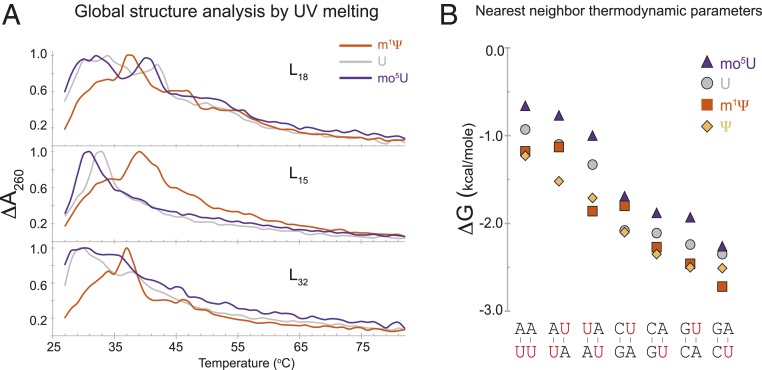
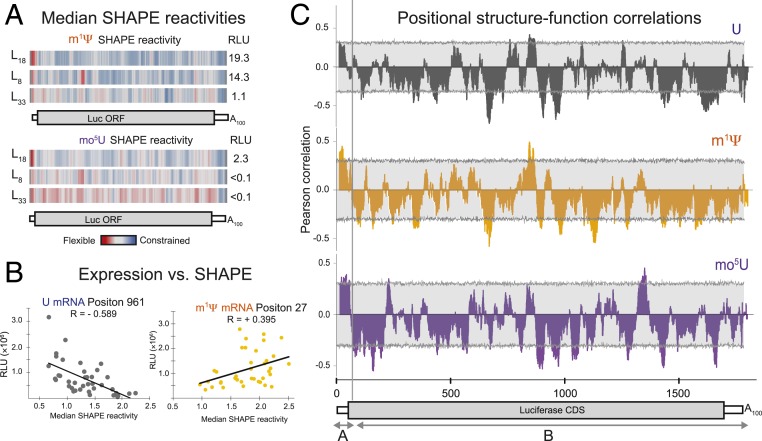
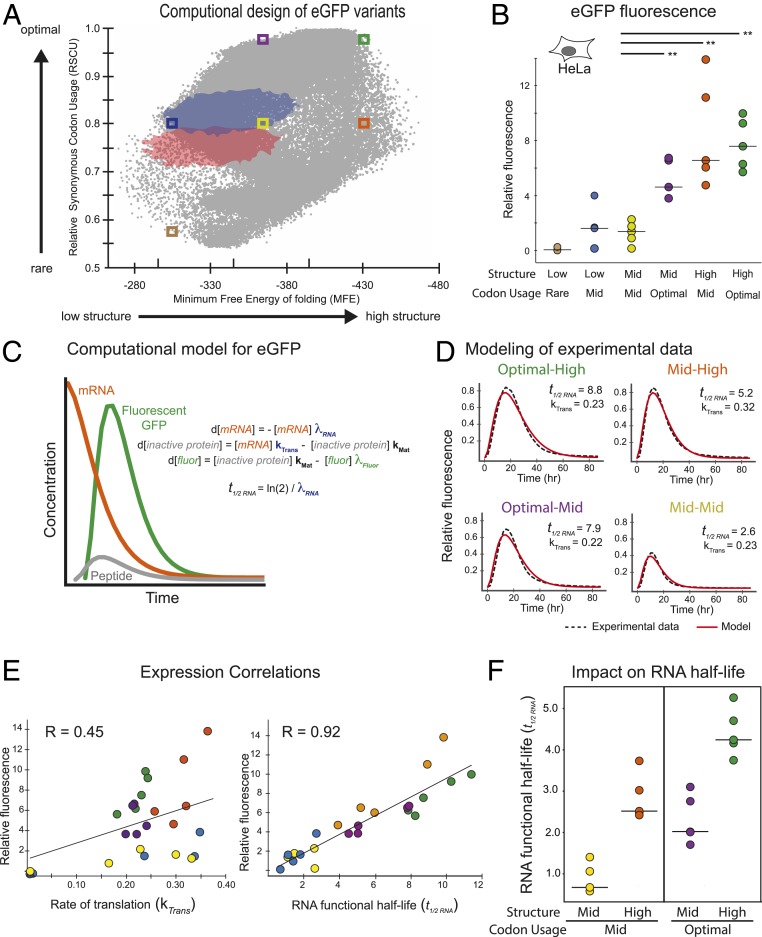
Messenger RNAs (mRNAs) encode information in both their primary sequence and their higher order structure. The independent contributions of factors like codon usage and secondary structure to regulating protein expression are difficult to establish as they are often highly correlated in endogenous sequences. Here, we used 2 approaches, global inclusion of modified nucleotides and rational sequence design of exogenously delivered constructs, to understand the role of mRNA secondary structure independent from codon usage. Unexpectedly, highly expressed mRNAs contained a highly structured coding sequence (CDS). Modified nucleotides that stabilize mRNA secondary structure enabled high expression across a wide variety of primary sequences. Using a set of eGFP mRNAs with independently altered codon usage and CDS structure, we find that the structure of the CDS regulates protein expression through changes in functional mRNA half-life (i.e., mRNA being actively translated). This work highlights an underappreciated role of mRNA secondary structure in the regulation of mRNA stability.

Keywords: RNA structure; SHAPE; mRNA therapuetics; modified nucleotides; translation.


Conflict of interest statement

Competing interest statement: All authors are employees (or ex-employees in the case of S.V.S., J.R., and B.J.C.) of Moderna, Inc.

Figures

Fig. 1.
Fig. 1.
Inclusion of modified nucleotides in mRNA alters eGFP and hEPO expression. (A) Chemical structure of uridine and 4 modified nucleosides: (Ψ, m1Ψ, mo5U, and m5C. (B) Fluorescence intensity (normalized intensity units, y axis) of HeLa cells following transfection with lipofectamine alone (−) or 4 different eGFP sequence variants (G1–G4, x axis) containing uridine (gray), m1Ψ (orange), Ψ (yellow), m5C/Ψ (lavender), or mo5U (dark purple). (C, Top) Schematic of the hEpo mRNA sequence variants. Eight hEpo sequences combined 1 of 2 “head” regions (dark gray box, HA or HB) encoding the first 30 amino acids (90 nucleotides) and 1 of 4 “body” regions (light gray box, E1–E4) encoding the remainder of the hEpo CDS. (C, Bottom) Levels of secreted hEpo protein measured by ELISA (ng/mL, y axis) following transfection of cells with 8 sequence variants (described in B above, x axis) plus 1 “codon optimized” variant (ECO) (44) containing uridine (gray bars), m1Ψ (orange), or mo5U (dark purple). (D) Serum concentrations of hEpo protein measured by ELISA (ng/mL, y axis) in BALB-c mice (5 per group) following IV injection of LNP-formulated mRNA of 6 sequence variants (described in B above, x axis) plus 1 codon optimized variant (ECO) (44) containing m1Ψ (orange) or mo5U (dark purple). Individual animals (dots) with mean and SE (black lines).
Fig. 2.
Fig. 2.
Inclusion of modified nucleotides in mRNA alters Luc expression. (A, Left) Expression in HeLa cells (relative light units [RLU], y axis) for 39 firefly Luciferase sequence variants (L1–L39, x axis) containing uridine (gray, Top), m1Ψ (orange, Middle), or mo5U (dark purple, Bottom). (A, Right) Distribution of expression levels (RLU, y axis) for variants (black dots) containing uridine (gray), m1Ψ (orange), and mo5U (dark purple) as a violin plot. (B) Expression in HeLa cells (RLU, y axis) of 39 firefly Luciferase variants grouped by the codon used (x axis) for all instances of serine (Top), phenylalanine (Middle), and threonine (Bottom) in mRNAs containing uridine (Left), m1Ψ (Middle), or mo5U (Right). Codons are shown in order of frequency of occurrence in the human transcriptome. Individual values (dots) are the same as in A with mean and SEs (black lines). Significant differences by 2-way ANOVA comparisons are indicated by lines above, and P values are noted by asterisks (*P ≤ 0.05, **P ≤ 0.01, ***P ≤ 0.001, and ****P ≤ 0.0001). (C) Total luminescence of in vivo firefly Luciferase expression (RLU, y axis) in CD-1 mice (5 per group) following IV injection of 0.15 mg/kg LNP-formulated mRNA for 10 sequence variants (x axis) containing m1Ψ (Top) or mo5U (Bottom). Individual animals (dots) with median.
Fig. 3.
Fig. 3.
Modified nucleotides induce global structural changes in mRNA. (A) Optical melting profiles of firefly Luciferase sequence variants (L18 Top, L15 Middle, and L32 Bottom) containing uridine (gray), m1Ψ (orange), or mo5U (dark purple) showing the change in UV absorbance at 260 nm (y axis) as a function of temperature (x axis). (B) Nearest-neighbor thermodynamic parameters for Watson–Crick base pairs (x axis) containing uridine (gray circles, values from ref. 20), Ψ (yellow diamonds), m1Ψ (orange squares), or mo5U (dark purple triangles). The modified nucleotides in each nearest neighbor are highlighted in red.
Fig. 4.
Fig. 4.
SHAPE data reveal a bipartite relationship between mRNA structure and protein expression. (A) Median SHAPE reactivity values (33-nt sliding window) for firefly Luc sequence variants L18 (Top), L8 (Middle), and L32 (Bottom), containing m1Ψ (orange, Top) or mo5U (purple, Bottom) shown as a heatmap: highly reactive (red), moderately reactive (gray), and lowly reactive (blue). Total luminescence values in mice from Fig. 2C are shown at Right. (B) Expression in HeLa cells (y axis, from Fig. 2A) for 39 firefly Luciferase variants (dots) containing uridine (dark gray, Top) or m1Ψ (orange, Bottom) versus median windowed SHAPE reactivity value (x axis) in 2 33-nt windows centered at the indicated positions. (C) Pearson correlations for SHAPE vs. protein expression in HeLa cells (y axis) across nucleotide positions (x axis) for 39 firefly Luciferase sequence variants containing U (dark gray, Top), m1Ψ (orange, Middle), or mo5U (dark purple, Bottom). The light gray boxes show the empirical 95% confidence interval at each position.
Fig. 5.
Fig. 5.
Half-life of computationally designed eGFP-degron mRNAs is determined by codon usage and mRNA structure. (A) Codon optimality (relative synonymous codon usage, y axis) versus secondary structure (energy of the predicted MFE structure, x axis) for sets of 150,000 generated eGFP sequence variants generated using codons chosen randomly (red), weighted in proportion to the human genome(blue), and using our algorithm (gray). Colored boxes show regions from which sequences were selected for further testing. (B) Total integrated eGFP fluorescence measured every 2 h for 86 h in HeLa cells (relative fluorescence unit [RFU], y axis) for 6 sets of 5 mRNAs containing m1Ψ (dots, with median as black line) with differing degrees of codon optimality and/or secondary structure (x axis, as in A). Significant differences by 2-way ANOVA comparisons are indicated by lines above, and P values are noted by asterisks (**P ≤ 0.01). (C) Model of eGFP expression kinetics. Simulated curves based on equations for changes in levels of mRNA (mRNA, orange), immature nonfluorescent protein (inactive protein, gray), and mature fluorescent protein (fluor, green) over time using exponential decay rates for mRNA (λRNA) and eGFP protein (λFluor), and rates of translation (kTrans) and protein maturation (kMAT). mRNA half-lives (t1/2 RNA) were calculated from the observed mRNA decay rates. (D) eGFP-degron fluorescence in HeLa cells (RFU, y axis) versus time (x axis) as measured experimentally (solid colored lines as in A) and fitted according to the model in C (dashed black lines) for representative sequence variants with differing degrees of codon optimality and/or secondary structure (as in A). Translation rate constants (kTrans) and mRNA half-lives (t1/2 RNA) as derived from the model described in C are shown. (E) Total eGFP-degron fluorescence in HeLa cells (RFU, y axis) versus the modeled rate constants for translation (kTrans, Left) or mRNA functional half-life (λRNA, Right) for 20 sequence variants containing m1Ψ as in D. Linear regression (black line) and Pearson correlation are shown. (F) Modeled functional mRNA half-lives (λRNA, y axis) for 4 sets of 5 eGFP-degron sequence variants with differing degrees of codon optimality and/or secondary structure (x axis, as in A and B).

Similar articles

Cited by

References

    1. Gustafsson C., Govindarajan S., Minshull J., Codon bias and heterologous protein expression. Trends Biotechnol. 22, 346–353 (2004). - PubMed
    1. Horstick E. J., et al. , Increased functional protein expression using nucleotide sequence features enriched in highly expressed genes in zebrafish. Nucleic Acids Res. 43, e48 (2015). - PMC - PubMed
    1. Weinberg D. E., et al. , Improved ribosome-footprint and mRNA measurements provide insights into dynamics and regulation of yeast translation. Cell Rep. 14, 1787–1799 (2016). - PMC - PubMed
    1. Presnyak V., et al. , Codon optimality is a major determinant of mRNA stability. Cell 160, 1111–1124 (2015). - PMC - PubMed
    1. Tulloch F., Atkinson N. J., Evans D. J., Ryan M. D., Simmonds P., RNA virus attenuation by codon pair deoptimisation is an artefact of increases in CpG/UpA dinucleotide frequencies. eLife 3, e04531 (2014). - PMC - PubMed

Publication types