. 2019 Nov 26;116(48):24334-24342.
doi: 10.1073/pnas.1907982116. Epub 2019 Nov 11.

Accelerated evolution of oligodendrocytes in the human brain

Affiliations

Accelerated evolution of oligodendrocytes in the human brain

Stefano Berto et al. Proc Natl Acad Sci U S A. .

Abstract

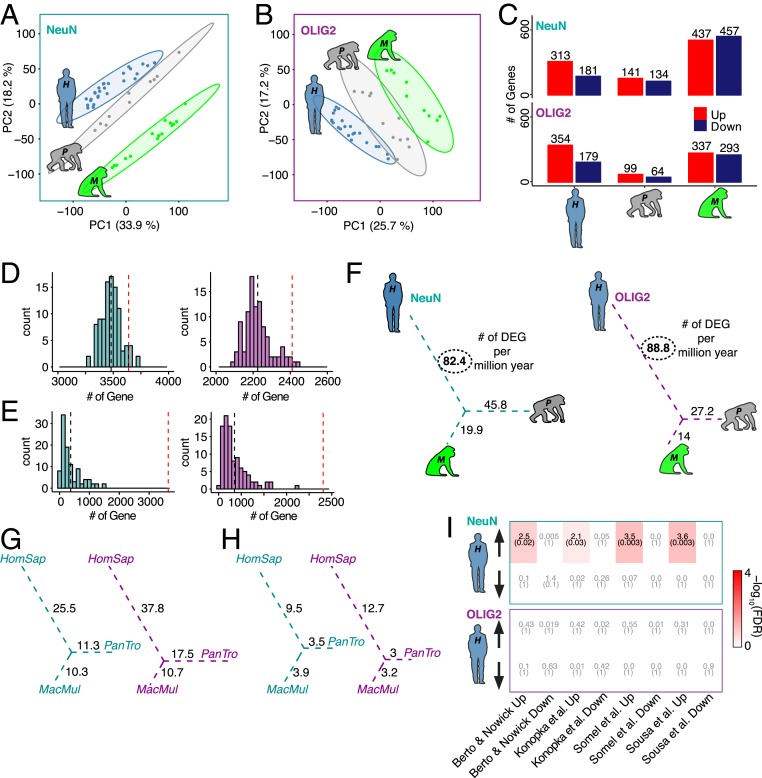
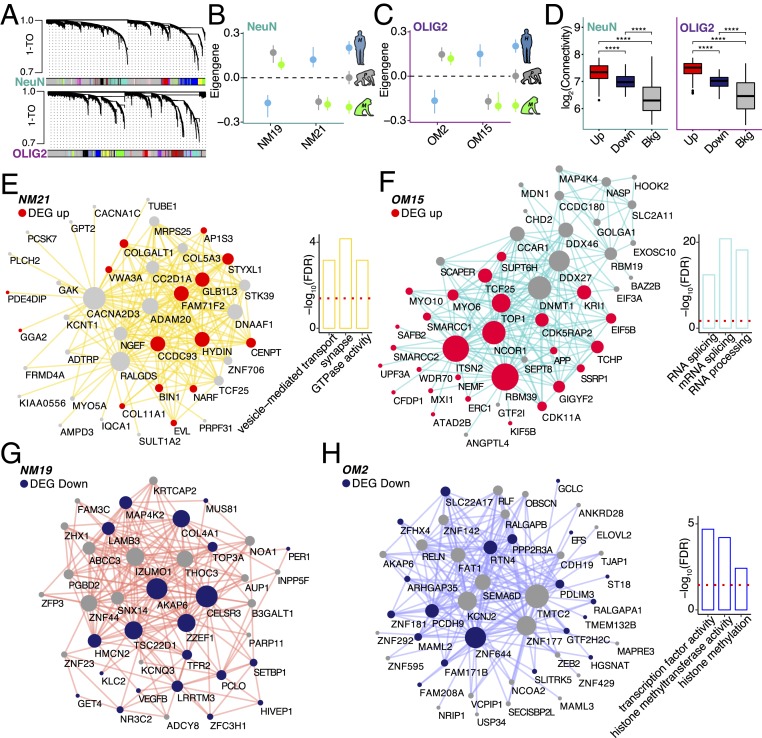
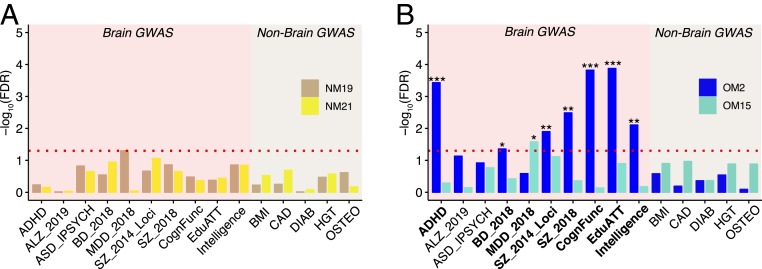
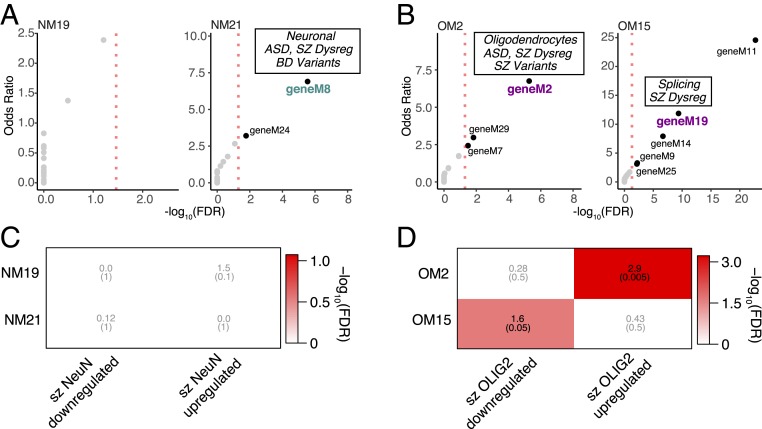
Recent discussions of human brain evolution have largely focused on increased neuron numbers and changes in their connectivity and expression. However, it is increasingly appreciated that oligodendrocytes play important roles in cognitive function and disease. Whether both cell types follow similar or distinctive evolutionary trajectories is not known. We examined the transcriptomes of neurons and oligodendrocytes in the frontal cortex of humans, chimpanzees, and rhesus macaques. We identified human-specific trajectories of gene expression in neurons and oligodendrocytes and show that both cell types exhibit human-specific up-regulation. Moreover, oligodendrocytes have undergone more pronounced accelerated gene expression evolution in the human lineage compared to neurons. We highlighted human-specific coexpression networks with specific functions. Our data suggest that oligodendrocyte human-specific networks are enriched for alternative splicing and transcriptional regulation. Oligodendrocyte networks are also enriched for variants associated with schizophrenia and other neuropsychiatric disorders. Such enrichments were not found in neuronal networks. These results offer a glimpse into the molecular mechanisms of oligodendrocytes during evolution and how such mechanisms are associated with neuropsychiatric disorders.

Keywords: brain evolution; cell-type expression; comparative primate genomics; neurogenomics.


Conflict of interest statement

The authors declare no competing interest.

Figures

Fig. 1.
Fig. 1.
Cell-type-specific differential gene expression analysis of 3 primates. (A and B) Principal component analysis of NeuN+ (A) and OLIG2+ (B) nuclei. Blue, human (H is H. sapiens); gray, chimpanzee (P is P. troglodytes); green, rhesus macaque (M is M. Mulatta). (C) Bar plots representing species-specific DEGs divided by up- (red) and down-regulated (dark blue) for both NeuN and OLIG2. (D) LOO cross-validation based on 100 bootstraps for NeuN (cyan) and OLIG2 (magenta). Observed numbers of DEGs (red dashed line) were falling in the distribution of the LOO DEGs based on ANOVA. (E) Permutation analysis based on 100 permutation comparisons based on subject randomization for NeuN (cyan) and OLIG2 (magenta). Observed numbers of DEGs (red dashed line) were significantly different from the randomized DEGs based on ANOVA. (F) The number of DEGs per million years for the unrooted tree of the study species of NeuN (cyan) and OLIG2 (magenta). (G) Down-sampled DEGs per million years based on 100 permutations. Values are calculated based on the average of species-specific DEGs for NeuN (cyan) and OLIG2 (magenta). (H) Down-sampled DEGs per million years based on 100 permutations for NeuN (cyan) and OLIG2 (magenta). Values are calculated based on the species-specific observed DEGs supported by the downsampling P value in >90% of downsampled sets (HomSap, H. sapiens; Pan Tro, P. troglodytes; MacMul, M. mulatta). (I) Heat map showing FDR (parentheses) and OR of gene set enrichment for both NeuN (Top) and OLIG2 (Bottom). Enrichment is based on a Fisher’s exact test. The x axis shows the representative data included for this analysis (7, 8, 21, 22).
Fig. 2.
Fig. 2.
Coexpression analyses identify human-specific modules. (A) Representative network dendrograms for NeuN (Top) and OLIG2 (Bottom). (B and C) Dot plots with standard errors (SEs) demonstrate the association of the modules detected by parsimony with species for NeuN (B) and OLIG2 (C). SEs are calculated based on the eigengene across samples. Dots represent the mean eigengene for that module. (D) Box plots show the difference in connectivity between human-specific genes in NeuN (Left) and OLIG2 (Right) across the entire coexpression network compared with the background genes (****P < 0.001; Wilcoxon’s rank sum test). (EH) Visualization of the top 200 connections ranked by weighted topological overlap values for NM21 (E), OM15 (F), NM19 (G), and OM2 (H). Node size corresponds to the number of edges (degree). Human-specific up-regulated genes are highlighted in red. Human-specific down-regulated genes are highlighted in blue. Side bar plots show the top 3 functions of the module based on −log10(FDR). Red dashed line corresponds to the FDR threshold of 0.05.
Fig. 3.
Fig. 3.
Human-specific genes are enriched for cognitive disease risk variants. (A and B) Bar plots highlighting the enrichment for genetic variants [−log10(FDR)]. Bars correspond to (A) NeuN modules (NM19: tan, NM21: yellow) and (B) OLIG2 modules (OM2: blue, OM15: turquoise) species-specific modules (***FDR < 0.001, **FDR < 0.01, *FDR < 0.05; MAGMA statistics). Red dashed line corresponds to the FDR threshold of 0.05. The x axis shows the acronyms for the GWAS data utilized for this analysis. ALZ, Alzheimer's disease; ASD, autism spectrum disorder from IPSYCH (Integrative Psychiatric Research); CognFunc, cognitive functions; EduATT, educational attainment; BMI, body mass index; CAD, coronary artery disease; DIAB, diabetes; HGT, height; OSTEO: osteoporosis.
Fig. 4.
Fig. 4.
Cell-type-specific expression in SZ is related to human-specific genes. (A) Bubble chart illustrates −log10(FDR) (x axis) and OR (y axis) of gene set enrichment for gene modules implicated in neuropsychiatric disorders (31) and NeuN human-specific modules. Marked the modules with functional conservation. Dysreg, dysregulated. (B) Bubble chart illustrates −log10(FDR) (x axis) and OR (y axis) of gene set enrichment for gene modules implicated in neuropsychiatric disorders (31) and OLIG2 human-specific modules. The modules with functional conservation with the PsychENCODE dataset are indicated. (C) Heat map illustrates FDR (parentheses) and OR of gene set enrichment (Fisher’s exact test). The x axis shows NeuN human-specific up-/down-regulated genes. The y axis shows SZ DEGs up-/down-regulated in NeuN. (D) Heat map illustrates FDR (parentheses) and OR of gene set enrichment. The x axis shows OLIG2 human-specific up-/down-regulated. The y axis shows SZ DEGs up-/down-regulated in OLIG2.

References

    1. Gabi M., et al. , No relative expansion of the number of prefrontal neurons in primate and human evolution. Proc. Natl. Acad. Sci. U.S.A. 113, 9617–9622 (2016). - PMC - PubMed
    1. Preuss T. M., “The human brain: Evolution and distinctive features” in On Human Nature, Tibayrenc M., Ayala F. J., Eds. (Academic Press, San Diego, 2017), chap. 8, pp. 125–149.
    1. Sousa A. M. M., Meyer K. A., Santpere G., Gulden F. O., Sestan N., Evolution of the human nervous system function, structure, and development. Cell 170, 226–247 (2017). - PMC - PubMed
    1. Khaitovich P., Enard W., Lachmann M., Pääbo S., Evolution of primate gene expression. Nat. Rev. Genet. 7, 693–702 (2006). - PubMed
    1. King M. C., Wilson A. C., Evolution at two levels in humans and chimpanzees. Science 188, 107–116 (1975). - PubMed

Publication types