. 2019 Nov 26;116(48):24285-24295.
doi: 10.1073/pnas.1912129116. Epub 2019 Nov 11.

Colorectal cancer-associated microbiota contributes to oncogenic epigenetic signatures

Affiliations

Colorectal cancer-associated microbiota contributes to oncogenic epigenetic signatures

Iradj Sobhani et al. Proc Natl Acad Sci U S A. .

Abstract

Sporadic colorectal cancer (CRC) is a result of complex interactions between the host and its environment. Environmental stressors act by causing host cell DNA alterations implicated in the onset of cancer. Here we investigate the stressor ability of CRC-associated gut dysbiosis as causal agent of host DNA alterations. The epigenetic nature of these alterations was investigated in humans and in mice. Germ-free mice receiving fecal samples from subjects with normal colonoscopy or from CRC patients were monitored for 7 or 14 wk. Aberrant crypt foci, luminal microbiota, and DNA alterations (colonic exome sequencing and methylation patterns) were monitored following human feces transfer. CRC-associated microbiota induced higher numbers of hypermethylated genes in murine colonic mucosa (vs. healthy controls' microbiota recipients). Several gene promoters including SFRP1,2,3, PENK, NPY, ALX4, SEPT9, and WIF1 promoters were found hypermethylated in CRC but not in normal tissues or effluents from fecal donors. In a pilot study (n = 266), the blood methylation levels of 3 genes (Wif1, PENK, and NPY) were shown closely associated with CRC dysbiosis. In a validation study (n = 1,000), the cumulative methylation index (CMI) of these genes was significantly higher in CRCs than in controls. Further, CMI appeared as an independent risk factor for CRC diagnosis as shown by multivariate analysis that included fecal immunochemical blood test. Consequently, fecal bacterial species in individuals with higher CMI in blood were identified by whole metagenomic analysis. Thus, CRC-related dysbiosis induces methylation of host genes, and corresponding CMIs together with associated bacteria are potential biomarkers for CRC.

Trial registration: ClinicalTrials.gov NCT01270360.

Keywords: biomarker; cancer; colon; gene methylation; microbiota.


Conflict of interest statement

Competing interest statement: I.S. shares rights in 3 patents: EP B31120, EP2635705, and EP 2955232 A1 20151216 based on methods for diagnosing adenomas and/or colorectal cancer.

Figures

Fig. 1.
Fig. 1.
Histological patterns of murine colonic mucosa following FMT. After the intestine was removed from cecum to anus, mucosa was carefully pinned flat, without folds, to examine the totality of the colonic mucosa which were stained with 0.2% methylene blue (left slides of coupled slides A to D) or HES (right slides of coupled slides A to D). Numbers of mice were as follows: n = 53 in 7-wk study (CRC-μ transfer, n = 30, and N-μ transfer, n = 23) and n = 132 in 14-wk study (CRC-μ transfer, n = 66, and N-μ transfer, n = 66). (Scale bar: 50 μm.) (A) After FMT from healthy human controls (N-μ), no ACF were visible in the colonic mucosa (here after 14 wk in Left), and pattern of crypts was normal by HES staining (Right). (B) Elevated numbers of ACF were observed after FMT from patients with CRC (CRC-µ) as compared to N-μ with multiple ACF (arrow in Left) as verified by HES (Right). (C) ACF counts were higher in the animals given AOM as compared to N-μ. Arrows indicate double ACF under blue coloration (Left) and illustration on HES slide of colonic mucosa. (D) The combination of CRC-µ and AOM increased the ACF count with dysplasia in rare cases (arrow). (E) No ACF nor inflammatory cell infiltrate was visible in mice given N-μ under NaCl (HES), although FISH staining showed density of bacteria trapped in the mucus layer (arrow, Left). (F) No ACF and no inflammatory cell infiltrate nor injury were noticed when mice received polyethylene glycol (PEG) in their drinking water as shown by H&S staining (HES) when FISH staining shows clear decrease in density of bacteria trapped in the proximal mucus layer (arrow). (G) Representative pictures of KI67 staining after human FMT from patients with CRC (CRC-µ) or from N-μ recipients. (H) Cell proliferation assessed by Ki67 staining and ACF quantification 7 and 14 wk after FMT in mice in the intestinal mucosa were higher in CRC-µ than in N-μ recipients. (I) The number of ACF counts were enhanced depending on the length of mucosa examined and the mice subgroups. (J) Comparative transcriptional levels of a set of inflammatory cytokines in the colonic mucosa assessed by murine cytokine qPCR quantification showing a trend to higher IL1, IL6, MIP2, and IL17 and lower IFNγ, IL10, and IL23 in mice given CRC-μ alone (fold vs. N-μ given mice) with AOM boosting this effect that reached significance for IL6, TNFα, and IL10 in mice given CRC-μ + AOM (vs. N-μ + AOM). (K) Inflammatory cell infiltrate in the colonic mucosa as assessed by semiquantification on HES stained slides (10 consecutive fields) under optic microscope magnification 20: a pathologist blinded to animal groups used a semiquantitative score to evaluate myeloid cell infiltrate in the colonic mucosa as 0, 1, and 2 indicating absence, scarce, and numerous inflammatory cells, respectively. The groups were compared by 1-way ANOVA followed by the Tukey–Kramer multiple comparisons post hoc test. No significant difference in between mice groups was observed. *P < 0.05; NS, not significant.
Fig. 2.
Fig. 2.
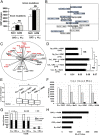
DNA changes in mice after human FMT. Whole genome sequencing of total DNA extracted from colonic mucosa (n = 12) and spleen samples (n = 6) was performed. (A) All single-nucleotide polymorphisms (SNPs) in the colon and spleen samples are compared to the reference mouse genome (GRCm38), and mutation levels within gene segments are indicated. Mice given AOM showed the highest levels of DNA alterations in exons or introns with a trend of additive effect of CRC-μ as compared to N-μ. (B) Distribution of animal subgroups according to the total gene mutations. DNA changes in single nucleotides with PcA scatter diagrams for colonic or spleen samples in the groups of mice. The groups are identified by the type of human microbiota received (CRC-μ or N-μ for CRC patients’ or controls’ stool, respectively) and type of treatment (AOM or NaCl for azoxymethane or saline, respectively). (C) Correlation circle of targeted gene mutations in the colonic mucosa and spleen tissues according to PcA. Vector length reflects targeted gene mutation weight in the first 2 component analyses; targeted mutated genes are indicated (those of Wnt pathway in red color). (D) When mutations in all Wnt genes were pooled together, rates of mutations were significantly higher in mice given AOM with an additive effect of CRC-μ. The total number of mutations in Wnt pathway genes in both colonic mucosa and spleen (Sp) was the highest in the animals given the CRC-μ and AOM combination (see also SI Appendix, Fig. S6). The number of mutations was greater in colonic mucosa (but not in spleen tissues) with AOM combined with CRC microbiota compared to AOM combined with control microbiota. There was no significant effect in between colonic mucosa due to CRC-μ alone as compared to N-μ alone. Col, colonic mucosa; Sp, spleen. (E) DNA epigenetic changes were investigated by using mEPIC array (39). The methylation level of probes (n = 63,987) were estimated after bisulfite modification of DNAs. Changes based on the methylation of probes were investigated on DNAs from colon samples (n = 16; 4 mice from each experimental group): the level of methylated probes was quantified as reported (39) and ranged from 0 (not methylated) to 1 (fully methylated). DNAs were classified as unmethylated if the methylation value was <0.2 and as hypermethylated if the methylation value was >0.799. Overall, mean and median values of all probes pooled (n = 63,987) in each group of mice showed lowest values in the group of CRC-μ + AOM recipients and highest in control microbiota recipients. (F) Most of the probes were unmethylated in all animal groups; elevated numbers of both hypomethylated and hypermethylated probes were observed in the mice given CRC-μ + AOM. (G) Probes whose methylation level changed or remained unchanged under AOM in mice given N-μ or CRC-μ. Mice receiving CRC-μ had a greater number of genes with changed methylation levels. (H) Number of hypermethylated probes in each group showing highest level in mice given CRC-μ and AOM combination compared to all other groups. **P < 0.01, *P < 0.05; NS, not significant.
Fig. 3.
Fig. 3.
Identification of hypermethylated genes related to fecal microbiota in human. Overview on the strategy from experimental approach for the validation of gene methylated targets in human based on microbiota donors (CRC patients or controls) in germ-free mice experiments. Methylated genes in CRC-associated tissues and fluids were identified based on their power for showing differences between normal colonoscopy individuals and CRC patients. (A) Human tissues and effluents were submitted to methylation gene array. Based on significant differences of methylation values in CpG probes between control (n = 9) and CRC patient (n = 9) donors, genes were selected according to the promoter segments hypermethylated in CRC patients. (B) Bidimensional (Right) and tridimensional (Left) distribution of genes regarding the difference in methylation values are indicated; in red color are indicated 7 selected more discriminant genes regarding CRC patients and controls. D, difference.
Fig. 4.
Fig. 4.
Distribution of bacteria in fecal microbiota from patients with CRC and controls with normal colonoscopy findings. Overall, 348 individuals from CCR2 cohort (173 asymptomatic individuals enrolled via a mass CRC-screening program and 165 patients from Vatnimad and symptomatic subcohorts, respectively) enrolled. Invasive carcinoma, carcinoma in situ, or specific carcinoma either on flat mucosa or within a polyp in the rectum or colon were defined as CRC (n = 177); controls had no malignancy or significant polyp visible by full colonoscopy (n = 171). (A) Pattern of microbiota clustering according to the diagnosis as assessed by principal coordinate analysis. The genus-level analysis based on distance matrix variances showed significant differences between CRC patients and controls. Fecal DNA was subjected to metagenomic sequencing of the conserved V3 to V4 region of the 16S rRNA gene. The amplicons were purified, quantified, and pooled and then sequenced on an Illumina MiSeq platform. For the analysis of 16S rRNA gene sequences, raw MiSeq FASTQ files were demultiplexed, quality-filtered using Trimmomatic, and merged. Taxonomic assignations were performed using Qiime2 (default parameters) with the SILVA-123 database. The statistical analysis was done with MetagenomeSeq (36). (B) Pattern of microbiota clustering according to the blood methylation test as assessed by principal coordinate analysis. Analysis of variance using distance matrices on 789 OTUs (metagenomeSeq_1.16.0) from 362 individuals (175 with normal colonoscopy findings and 187 with advanced neoplasia) demonstrated a significant difference between the groups with positive and negative blood CMI values (>2 and ≤2, respectively). (C) Distribution of genera in fecal microbiota in the groups with positive and negative blood CMI values (>2 and ≤2, respectively) (Shaman c3bi platform; Institut Pasteur, http://shaman.c3bi.pasteur.fr/). A maximum likelihood phylogenetic tree was tested (Individuals, Materials, and Methods). Brown to red colors indicate negative CMI results (≤2), and blue colors indicate positive CMI results (>2). Note that diversity was less in the group with a positive CMI compared to the group with a negative CMI.

References

    1. Guyton K. Z., et al. ; International Agency for Research on Cancer Monograph Working Group, IARC, Lyon, France , Carcinogenicity of tetrachlorvinphos, parathion, malathion, diazinon, and glyphosate. Lancet Oncol. 16, 490–491 (2015). - PubMed
    1. López-Abente G., García-Pérez J., Fernández-Navarro P., Boldo E., Ramis R., Colorectal cancer mortality and industrial pollution in Spain. BMC Public Health 12, 589 (2012). - PMC - PubMed
    1. Wild C. P., Complementing the genome with an “exposome”: The outstanding challenge of environmental exposure measurement in molecular epidemiology. Cancer Epidemiol. Biomarkers Prev. 14, 1847–1850 (2005). - PubMed
    1. Ghantous A., Hernandez-Vargas H., Byrnes G., Dwyer T., Herceg Z., Characterising the epigenome as a key component of the fetal exposome in evaluating in utero exposures and childhood cancer risk. Mutagenesis 30, 733–742 (2015). - PMC - PubMed
    1. Guinney J., et al. , The consensus molecular subtypes of colorectal cancer. Nat. Med. 21, 1350–1356 (2015). - PMC - PubMed

Publication types

MeSH terms

Substances

Associated data