. 2019 Nov 11;9(1):16491.
doi: 10.1038/s41598-019-52921-z.

Sirtuin 3 deficiency does not impede digit regeneration in mice

Affiliations

Sirtuin 3 deficiency does not impede digit regeneration in mice

Emily Busse et al. Sci Rep. .

Abstract

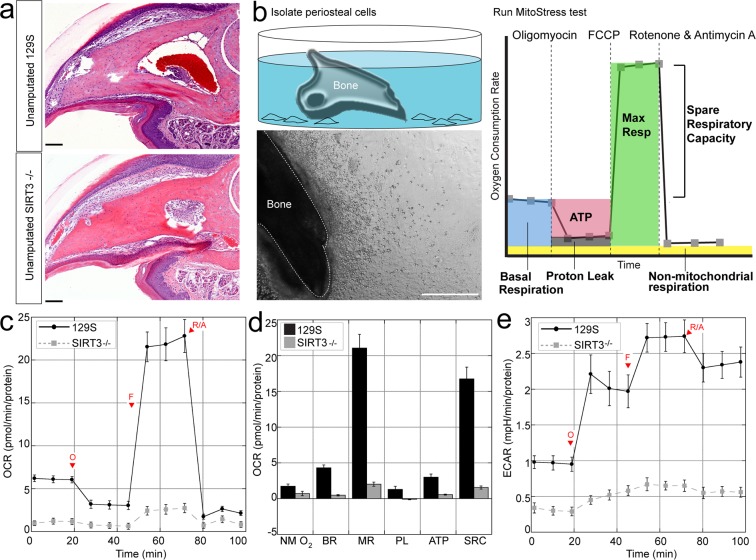
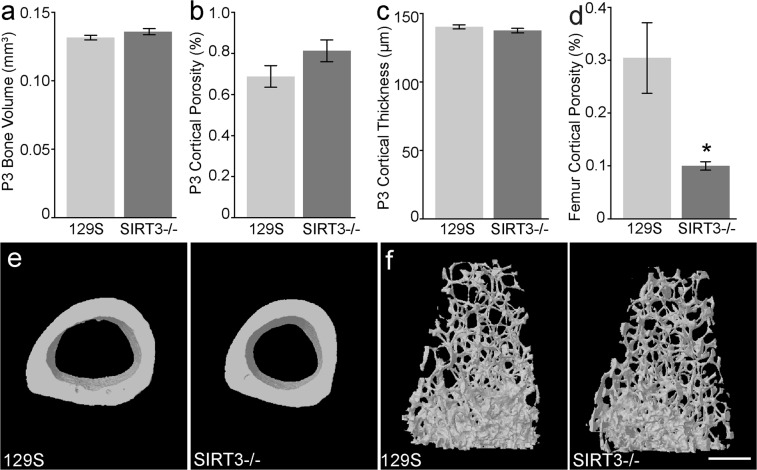
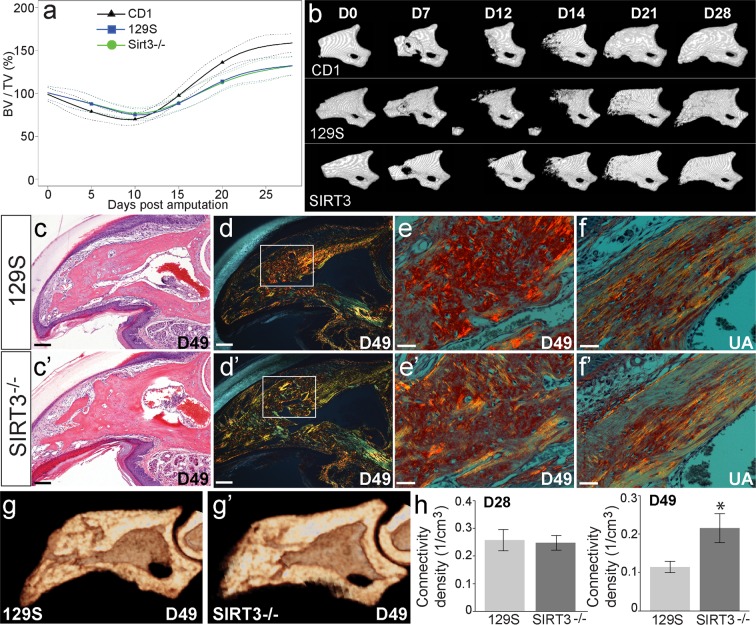
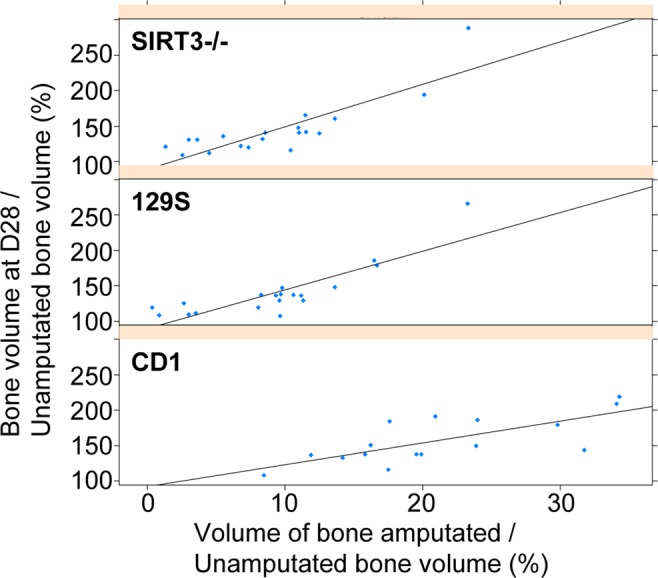
The mitochondrial deacetylase sirtuin 3 (SIRT3) is thought to be one of the main contributors to metabolic flexibility-promoting mitochondrial energy production and maintaining homeostasis. In bone, metabolic profiles are tightly regulated and the loss of SIRT3 has deleterious effects on bone volume in vivo and on osteoblast differentiation in vitro. Despite the prominent role of this protein in bone stem cell proliferation, metabolic activity, and differentiation, the importance of SIRT3 for regeneration after bone injury has never been reported. We show here, using the mouse digit amputation model, that SIRT3 deficiency has no impact on the regenerative capacity and architecture of bone and soft tissue. Regeneration occurs in SIRT3 deficient mice in spite of the reduced oxidative metabolic profile of the periosteal cells. These data suggest that bone regeneration, in contrast to homeostatic bone turnover, is not reliant upon active SIRT3, and our results highlight the need to examine known roles of SIRT3 in the context of injury.


Conflict of interest statement

The authors declare no competing interests.

Figures

Figure 1
Figure 1
Periosteal cells from SIRT3−/− mice show reduced metabolic capacity. (a) Hematoxlylin and eosin staining of the unamputated third phalangeal element (P3) bones of SIRT3−/− and wildtype 129S littermates show no histological differences in the adult 8-week old mice. Scale bar = 50 μm. N = 4 with representative image shown. (b) We isolate P3 bones from knockout and wildtype littermates and allow periosteal cells to crawl onto a dish. Scale bar = 500 μm. (c) The P3 periosteal cells are assayed using the Seahorse Mito Stress Test. Changes in oxygen consumption rate are measured after injections of oligomyocin, FCCP, and antimycin A and rotenone. SIRT3−/− cells show reduced oxygen consumption rate over time (OCR) compared to 129S littermates and (d) reduced non-mitochondrial oxygen consumption (NM O2), basal respiration (BR), maximal respiration (MR), proton leak (PL) ATP production (ATP), and spare respiratory capacity (SRC). All data were normalized to total protein. Error bars represent SEM (N = 10 wells). All comparisons are significant p < 0.05. (e) SIRT3−/− cells show reduced extracellular acidification rate (ECAR) over time compared to 129S control cells.
Figure 2
Figure 2
Femurs but not P3 bones of SIRT3−/− mice show homeostatic defects. μCT analysis of the uninjured P3 bone reveals (a) total bone volume, (b) cortical porosity, and (c) cortical thickness are comparable between SIRT3−/− and 129S wildtype littermates (N = 5 mice, N = 20 digits). (d,e) SIRT3−/− femurs show decreased cortical porosity compared to 129S control mice. (f) Representative μCT images of the trabecular bone of the femur of adult 129S and SIRT3−/− mice. N = 4 with representative sample shown. Scale bar represents 500 μm. Error bars represent SEM *p = 0.023.
Figure 3
Figure 3
SIRT3 is not a limiting factor in digit regeneration. (a) μCT analysis of changes in bone volume over time following amputation shows no significant difference between SIRT3−/− (green line circle) and 129S (blue line square) regenerative ability (N = 5 mice, N = 20 digits). CD1 outbred mice (black line triangle) are used as a standard amputation model for comparison (N = 4 mice, N = 16 digits). Data are normalized to amputated day 0 bone volume and analyzed using SS ANOVA models. (b) Representative μCT images of a regenerating P3 digit in CD1, SIRT3−/−, and 129S regenerates show no phenotypic differences at 28 days post amputation. (c,c’) H&E staining of day 49 sections of 129S (c) and SIRT3−/− (c’) mice. Scale bar represents 50 μm. (d,d’) Picrosirius red staining and polarized light microscopy show collagen fiber alignment in woven bone of the regenerated digits at day 49 in 129S (d) and SIRT3−/− (d’) mice. Scale bar represents 50 μm. (e’) Higher power images of d, d’ showing cross-hatched collagen alignment representative of woven bone in both 129S (e) and SIRT3−/− (e’) regenerates. Scale bar represents 30 μm. (f,f’) For comparison, polarized light microscopy shows parallel collagen fiber alignment in the cortical bone of unamputated digits in 129S (f) and SIRT3−/− (f’) mice. Scale bar represents 30 μm (g,g’) μCT cross-sectional analysis of regenerated digits at D49 to measure trabecular architecture in 129S and SIRT3−/− mice. (h) Quantification of μCT data reveals trabeculae with greater connectivity density in the SIRT3−/− mice compared to 129S controls at 49 days post amputation but not at 28 days post amputation. N = 4 for histology sections with representative images shown. Error bars represent SEM *p = 0.0162.
Figure 4
Figure 4
Level of amputation influences digit regeneration across mouse strains. Scatter plot showing the correlation between the volume of bone amputated and the amount of bone regeneration after amputation for SIRT3−/−, 129S, and CD1 mice with fitted regression lines. Amputation of approximately 10% of the bone volume results in 100% bone regrowth volume. Amputation of 20% or more of the original bone volume results in a final volume that exceeds the original bone volume. (N = 5 mice, N = 20 digits).

References

    1. Riddle RC, Clemens TL. Bone Cell Bioenergetics and Skeletal Energy Homeostasis. Physiol Rev. 2017;97:667–698. doi: 10.1152/physrev.00022.2016. - DOI - PMC - PubMed
    1. Shum LC, White NS, Mills BN, Bentley KL, Eliseev RA. Energy Metabolism in Mesenchymal Stem Cells During Osteogenic Differentiation. Stem Cells Dev. 2016;25:114–122. doi: 10.1089/scd.2015.0193. - DOI - PMC - PubMed
    1. Guntur AR, Le PT, Farber CR, Rosen CJ. Bioenergetics during calvarial osteoblast differentiation reflect strain differences in bone mass. Endocrinology. 2014;155:1589–1595. doi: 10.1210/en.2013-1974. - DOI - PMC - PubMed
    1. Arnett TR, Orriss IR. Metabolic properties of the osteoclast. Bone. 2018;115:25–30. doi: 10.1016/j.bone.2017.12.021. - DOI - PubMed
    1. Lemma S, et al. Energy metabolism in osteoclast formation and activity. Int J Biochem Cell Biol. 2016;79:168–180. doi: 10.1016/j.biocel.2016.08.034. - DOI - PubMed

Publication types

LinkOut - more resources