. 2019 Nov 11;9(1):16488.
doi: 10.1038/s41598-019-52829-8.

Differentiation of multiple system atrophy from Parkinson's disease by structural connectivity derived from probabilistic tractography

Affiliations

Differentiation of multiple system atrophy from Parkinson's disease by structural connectivity derived from probabilistic tractography

Alexandra Abos et al. Sci Rep. .

Abstract

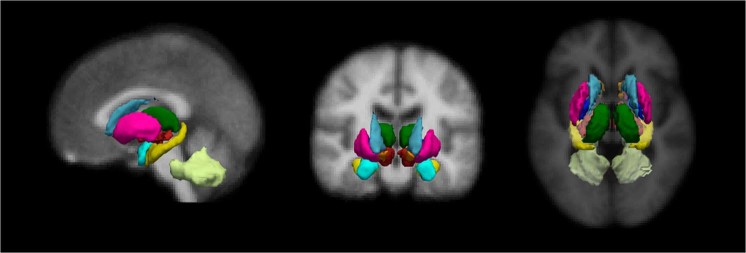
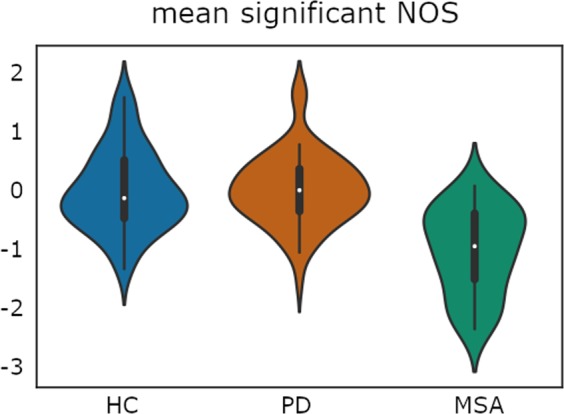
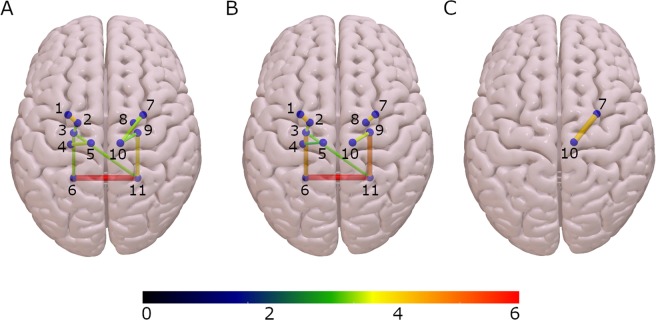
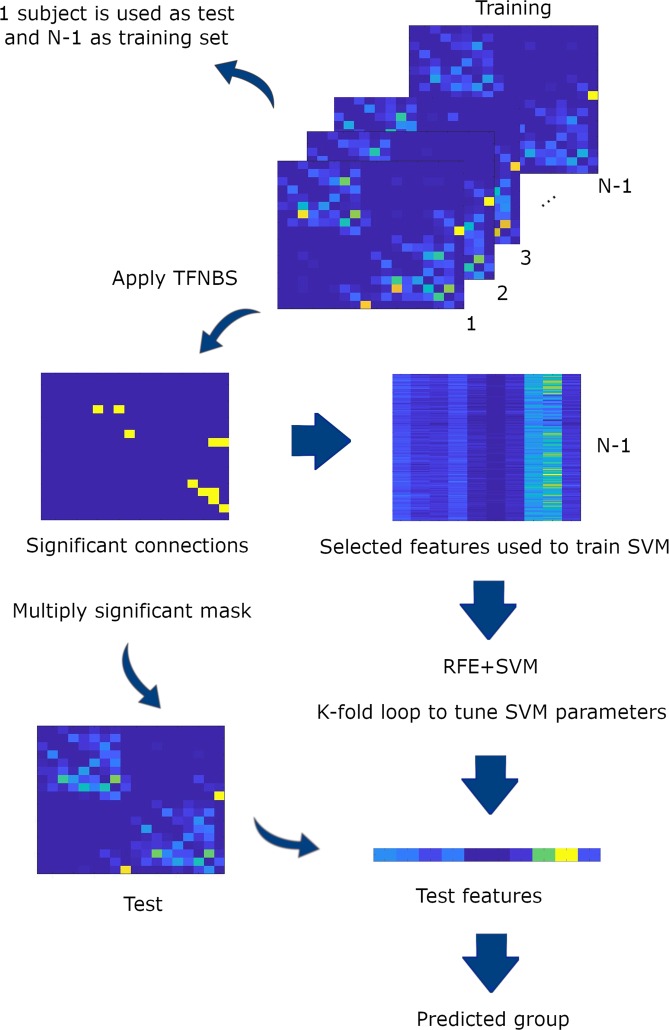
Recent studies combining diffusion tensor-derived metrics and machine learning have shown promising results in the discrimination of multiple system atrophy (MSA) and Parkinson's disease (PD) patients. This approach has not been tested using more complex methodologies such as probabilistic tractography. The aim of this work is assessing whether the strength of structural connectivity between subcortical structures, measured as the number of streamlines (NOS) derived from tractography, can be used to classify MSA and PD patients at the single-patient level. The classification performance of subcortical FA and MD was also evaluated to compare the discriminant ability between diffusion tensor-derived metrics and NOS. Using diffusion-weighted images acquired in a 3 T MRI scanner and probabilistic tractography, we reconstructed the white matter tracts between 18 subcortical structures from a sample of 54 healthy controls, 31 MSA patients and 65 PD patients. NOS between subcortical structures were compared between groups and entered as features into a machine learning algorithm. Reduced NOS in MSA compared with controls and PD were found in connections between the putamen, pallidum, ventral diencephalon, thalamus, and cerebellum, in both right and left hemispheres. The classification procedure achieved an overall accuracy of 78%, with 71% of the MSA subjects and 86% of the PD patients correctly classified. NOS features outperformed the discrimination performance obtained with FA and MD. Our findings suggest that structural connectivity derived from tractography has the potential to correctly distinguish between MSA and PD patients. Furthermore, NOS measures obtained from tractography might be more useful than diffusion tensor-derived metrics for the detection of MSA.


Conflict of interest statement

The authors declare no competing interests.

Figures

Figure 1
Figure 1
Eighteen subcortical region of interest (ROI) from FreeSurfer. Representation of the subcortical parcellation used in this study (for right and left hemispheres): the bilateral nucleus accumbens; amygdala; caudate nucleus; hippocampus; pallidum; putamen; thalamus; ventral diencephalon (including the hypothalamus, mammillary body, subthalamic nuclei, substantia nigra, red nucleus) and cerebellar white matter, including the middle cerebellar peduncles.
Figure 2
Figure 2
Plot illustrates the distribution of the average number of streamlines (NOS) between the 10 significantly reduced tracts found in MSA patients using threshold-free network based statistics (TFNBS). NOS values were Z-transformed to calculate the global mean value comprising all significant connections; HC: healthy controls; PD: Parkinson’s disease group; MSA: multiple system atrophy group. Plot width represents the frequency (density) of values; the height indicates the upper (max) and lower (min) limits.
Figure 3
Figure 3
Connectivity differences between groups patients using threshold-free network based statistics (TFNBS). (A) Connectivity differences between healthy controls and multiple system atrophy patients. (B) Connectivity differences between Parkinson’s disease and multiple system atrophy patients. (C) Connectivity differences between healthy controls and Parkinson’s disease patients. Brain edges are scaled according to the value of the T statistic (shown in the color bar), p < 0.05, FDR corrected. 1: Left Putamen; 2: Left Pallidum; 3: Left Ventral diencephalon; 4: Left Hippocampus; 5: Left Thalamus; 6: Left Cerebellum; 7: Right Putamen; 8: Right Pallidum; 9: Right Ventral diencephalon; 10: Right Thalamus; 11: Right Cerebellum.
Figure 4
Figure 4
Classification procedure. Representation of one iteration of the feature selection and machine learning procedure. For each iteration, one subject was defined as the test set, whereas the remaining N-1 subjects made up the training set. Each training set was then fed into the TFNBS to calculate the significant connections between groups. Subsequently, the significant connections were introduced into a recursive feature elimination (RFE) algorithm to select the optimal connections. The support vector machine (SVM) algorithm was then tuned with the selected features. The resulting classifier model was then used to classify the corresponding test subject.

References

    1. Fanciulli A, Wenning GK. Multiple-System Atrophy. N. Engl. J. Med. 2015;372:249–263. doi: 10.1056/NEJMra1311488. - DOI - PubMed
    1. Peeraully T. {Multiple} {System} {Atrophy} Semin. Neurol. 2014;34:174–181. doi: 10.1055/s-0034-1381737. - DOI - PubMed
    1. Baglieri A, et al. Differences between conventional and nonconventional MRI techniques in Parkinson’s disease. Funct. Neurol. 2013;28:73–82. - PMC - PubMed
    1. Savoiardo M. Differential diagnosis of Parkinson’s disease and atypical parkinsonian disorders by magnetic resonance imaging. Neurol. Sci. 2003;24(Suppl 1):S35–7. doi: 10.1007/s100720300036. - DOI - PubMed
    1. Wang PS, Wu HM, Lin CP, Soong BW. Use of diffusion tensor imaging to identify similarities and differences between cerebellar and Parkinsonism forms of multiple system atrophy. Neuroradiology. 2011;53:471–481. doi: 10.1007/s00234-010-0757-7. - DOI - PubMed

Publication types