
Bipolar multiplex families have an increased burden of common risk variants for psychiatric disorders

Till F M Andlauer et al. Mol Psychiatry. 2021 Apr.

Abstract

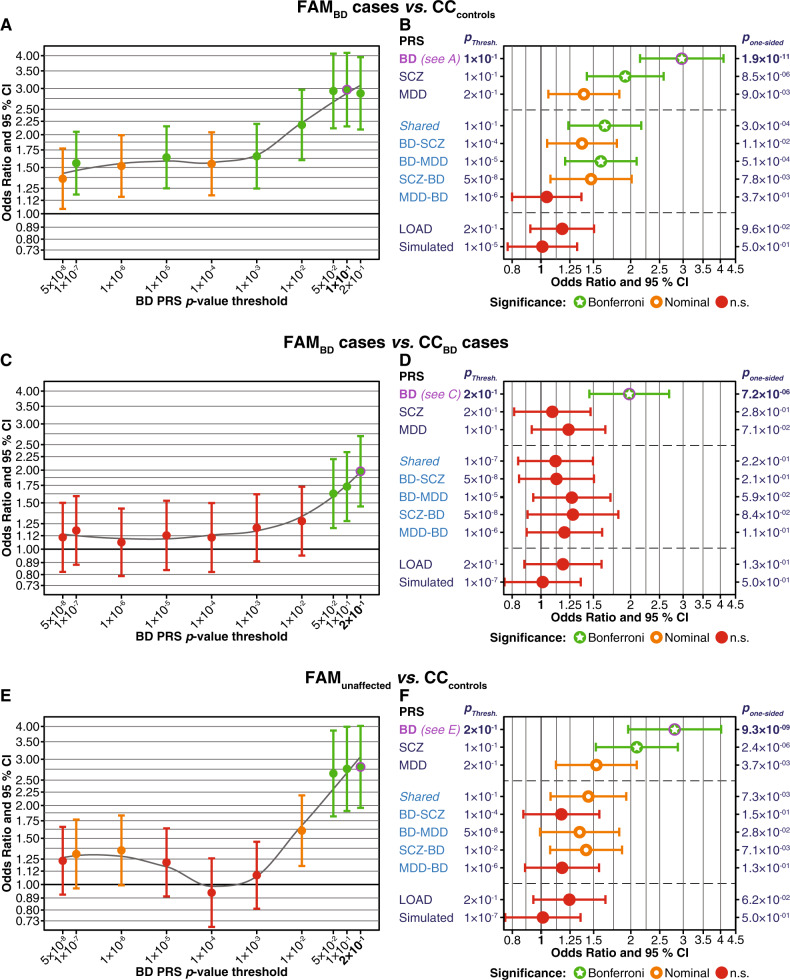
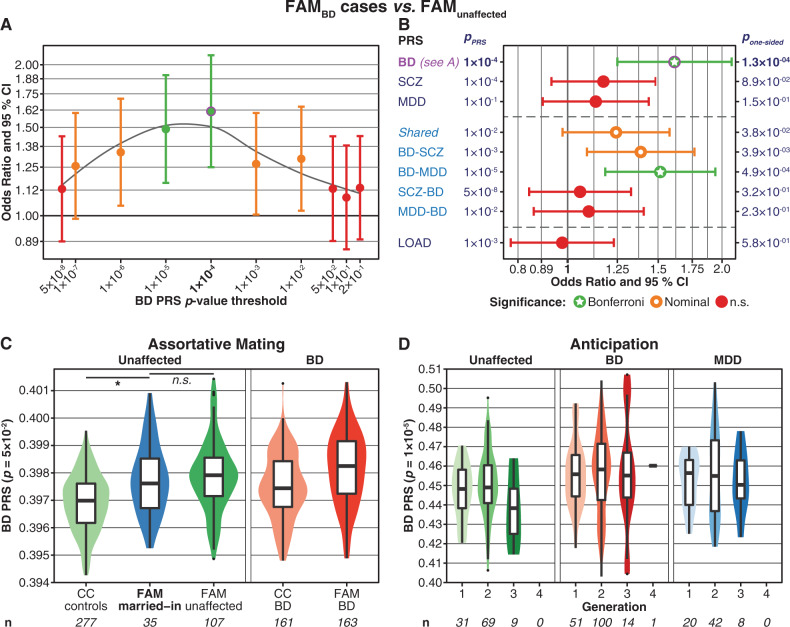
Multiplex families with a high prevalence of a psychiatric disorder are often examined to identify rare genetic variants with large effect sizes. In the present study, we analysed whether the risk for bipolar disorder (BD) in BD multiplex families is influenced by common genetic variants. Furthermore, we investigated whether this risk is conferred mainly by BD-specific risk variants or by variants also associated with the susceptibility to schizophrenia or major depression. In total, 395 individuals from 33 Andalusian BD multiplex families (166 BD, 78 major depressive disorder, 151 unaffected) as well as 438 subjects from an independent, BD case/control cohort (161 unrelated BD, 277 unrelated controls) were analysed. Polygenic risk scores (PRS) for BD, schizophrenia (SCZ), and major depression were calculated and compared between the cohorts. Both the familial BD cases and unaffected family members had higher PRS for all three psychiatric disorders than the independent controls, with BD and SCZ being significant after correction for multiple testing, suggesting a high baseline risk for several psychiatric disorders in the families. Moreover, familial BD cases showed significantly higher BD PRS than unaffected family members and unrelated BD cases. A plausible hypothesis is that, in multiplex families with a general increase in risk for psychiatric disease, BD development is attributable to a high burden of common variants that confer a specific risk for BD. The present analyses demonstrated that common genetic risk variants for psychiatric disorders are likely to contribute to the high incidence of affective psychiatric disorders in the multiplex families. However, the PRS explained only part of the observed phenotypic variance, and rare variants might have also contributed to disease development.


Conflict of interest statement

The authors declare that they have no conflict of interest.

Figures

Fig. 1
Fig. 1
Comparison of PRS between FAM and CC samples. Married-in family members were excluded from these analyses. The plots show one-sided p-values, following the hypothesis that family members have higher PRS than individuals from the CC samples. All PRS have been normalised using Z-score standardisation. a, b Comparison of FAMBD cases to CCcontrols. a FAMBD cases had higher BD PRS across all ten pPRS thresholds. The plot shows odds ratios (OR, y-axis, filled circles) and 95% confidence intervals (CI); pPRS thresholds are shown on the x-axis. Results for each threshold are coloured by their degree of significance (one-sided p-values): red = not significant, orange = nominally significant, green = significant after Bonferroni correction for multiple testing (α = 0.05/60 = 0.00083). The top-associated PRS (pPRS = 0.1) is indicated in bold font and was marked by a magenta circle (also in b). b For ten different PRS, this plot shows association statistics for the top-associated pPRS thresholds. The x-axis shows ORs. BD, SCZ, MDD: Standard PRS using the respective PGC GWAS summary statistics. Shared: Shared psychiatric PRS (SNPs with BD, MDD, SCZ p < 0.05, random-effects meta-analysis). BD-SCZ, BD-MDD: BD-specific GWIS PRS corrected for SCZ and MDD, respectively. SCZ-BD and MDD-BD: GWIS PRS for SCZ and MDD, each corrected for BD. LOAD: PRS for late-onset Alzheimer’s disease. Simulated: Mean and CI of the 10,000 simulated PRS at the pPRS with the lowest mean association p-value of all simulated PRS. The column to the left of the plot: pPRS with the strongest association. Supplementary Fig. S2 shows plots for all pPRS. Column to the right: pone-sided = one-sided p-value. For full association test statistics, see Supplementary Table S3. Bonferroni = significant after Bonferroni correction for multiple testing; nominal = nominally significant (p < 0.05); n.s. = not significant. c, d Comparison of FAMBD cases and unrelated CCBD cases. See Supplementary Fig. S3 and Table S4 for more detailed plots and full association test statistics. e, f Comparison of FAMunaffected and CCcontrols. See Supplementary Fig. S4 and Table S5 for more detailed plots and full association test statistics
Fig. 2
Fig. 2
a, b Comparison of PRS between FAMBD cases and FAMunaffected. The plots show one-sided p-values, following the hypothesis that BD cases have higher PRS than unaffected individuals. Further details of the plots are as described in the legend for Fig. 1. See Supplementary Fig. S5 and Table S6 for more detailed plots and full association test statistics. c, d Analyses of assortative mating (c) and anticipation (d). These plots were not adjusted for covariates; n = sample size. The y-axis shows the PRS values. c: Assortative mating. The plot shows violin- and boxplots of the BD PRS (pPRS = 0.05), comparing unaffected, married-in individuals with no parent among the ABiF families to other FAM and CC subjects. At pPRS = 0.05, married-in family members showed the highest BD PRS compared to CCcontrols (p = 6.5 × 10−5, Supplementary Fig. S6A and Table S7). The BD PRS of married-in individuals was not significantly higher than the PRS of FAMunaffected at any pPRS (p ≥ 0.167, Supplementary Fig. S6B and Table S7). Covariate used: sex. One-sided p-values were calculated, following the hypothesis that married-in individuals have higher PRS than other unaffected subjects. Note that, in the context of assortative mating, the boxplots of affected BD cases are displayed for reference only and have not been included in the analysis. d Anticipation: the BD PRS did not increase across generations. The plot shows violin- and boxplots of the BD PRS (pPRS = 1 × 10−5) across different generations of the FAM sample for the three diagnosis groups. At pPRS = 1 × 10−5, the association of the BD PRS with generation was strongest but not significant (p = 0.45; Supplementary Fig. S7A and Table S8). Married-in family members were excluded from this analysis. Covariates used: sex, age at the interview, diagnostic group. One-sided p-values were calculated, following the hypothesis that the PRS increase across generations

References

    1. Merikangas KR, Jin R, He J-P, Kessler RC, Lee S, Sampson NA, et al. Prevalence and correlates of bipolar spectrum disorder in the world mental health survey initiative. Arch Gen Psychiatry. 2011;68:241–51. - PMC - PubMed
    1. Craddock N, Sklar P. Genetics of bipolar disorder. Lancet. 2013;381:1654–62. - PubMed
    1. Edvardsen J, Torgersen S, Røysamb E, Lygren S, Skre I, Onstad S, et al. Heritability of bipolar spectrum disorders. Unity or heterogeneity? J Affect Disord. 2008;106:229–40. - PubMed
    1. McGuffin P, Rijsdijk F, Andrew M, Sham P, Katz R, Cardno A. The heritability of bipolar affective disorder and the genetic relationship to unipolar depression. Arch Gen Psychiatry. 2003;60:497–502. - PubMed
    1. Charney AW, Ruderfer DM, Stahl EA, Moran JL, Chambert K, Belliveau RA, et al. Evidence for genetic heterogeneity between clinical subtypes of bipolar disorder. Transl Psychiatry. 2017;7:e993. - PMC - PubMed

Publication types

MeSH terms