. 2020 Jan;68(1):75-91.
doi: 10.1369/0022155419884879. Epub 2019 Nov 12.

Tissue-specific Fixation Methods Are Required for Optimal In Situ Visualization of Hyaluronan in the Ovary, Kidney, and Liver

Affiliations

Tissue-specific Fixation Methods Are Required for Optimal In Situ Visualization of Hyaluronan in the Ovary, Kidney, and Liver

Jennifer E Rowley et al. J Histochem Cytochem. 2020 Jan.

Abstract

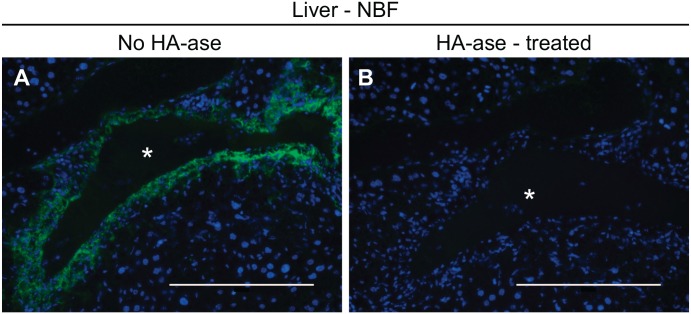
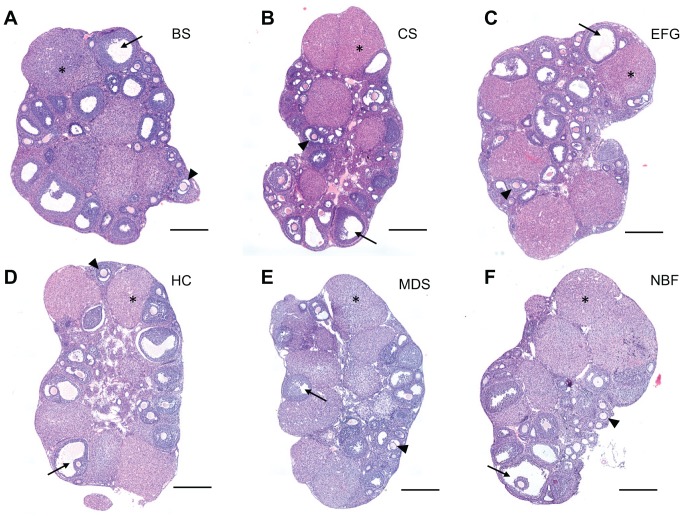
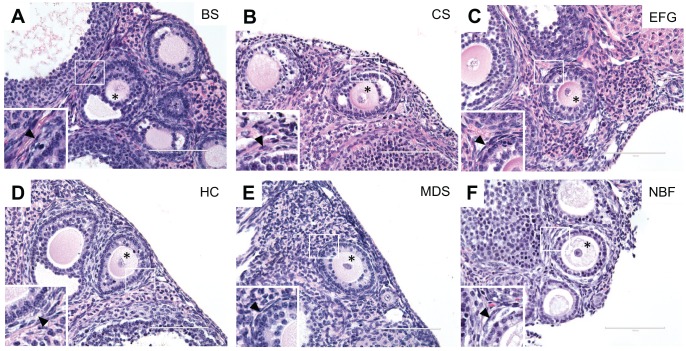
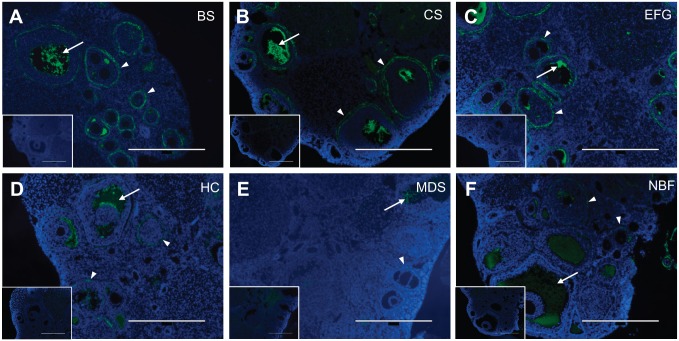
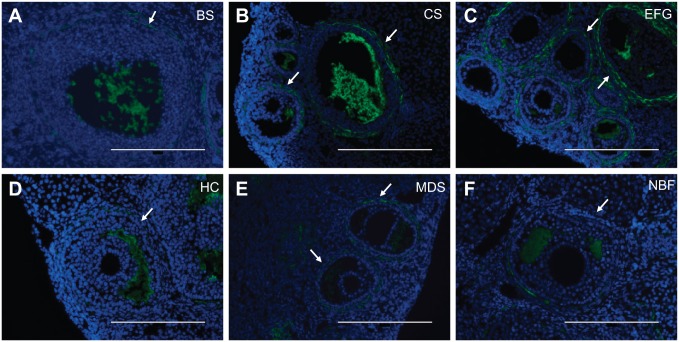
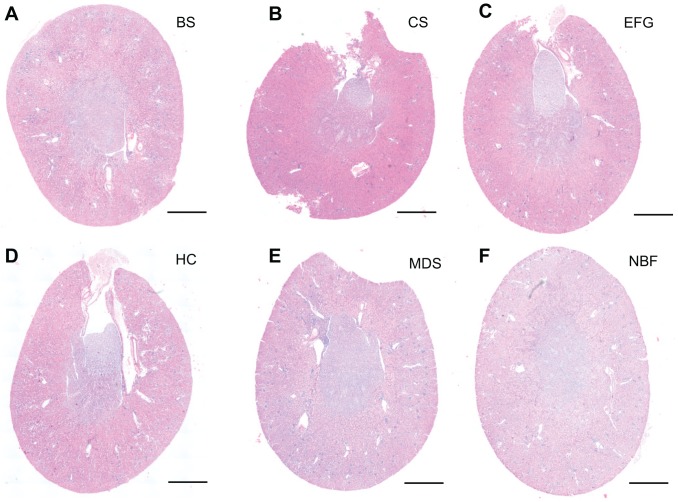
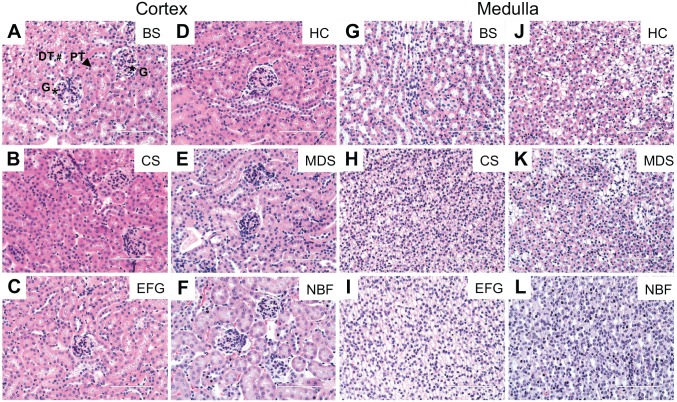
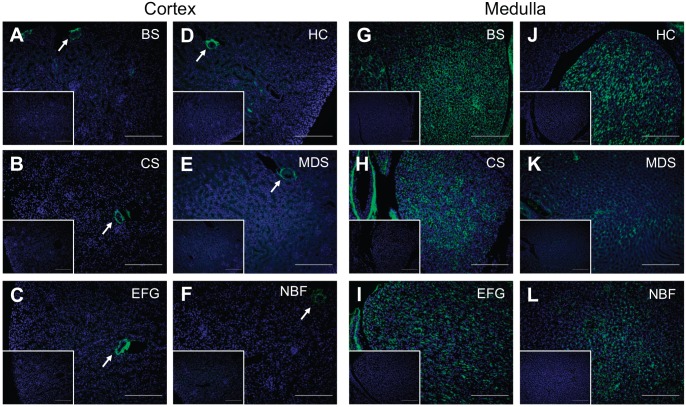
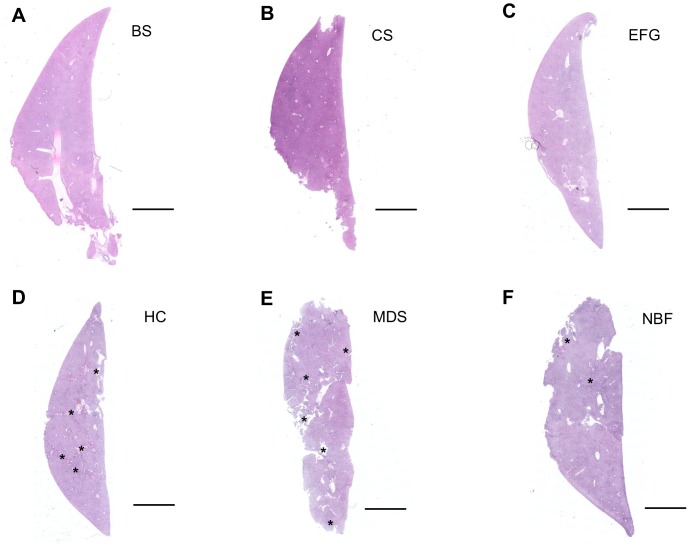
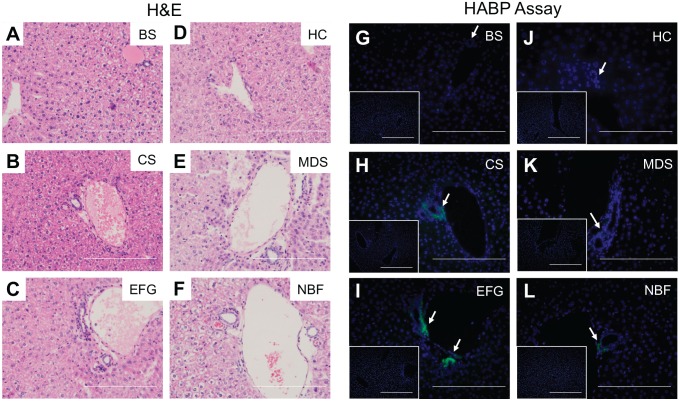
Hyaluronan (HA) is a ubiquitous component of the extracellular matrix. The spatial-temporal localization of HA can be visualized in situ using biotinylated HA binding proteins (HABPs). This assay is sensitive to fixation conditions, and there are currently no best practices for HA detection. Thus, the goal of this study was to optimize fixation conditions for visualizing HA in the ovary, kidney, and liver through analysis of six commonly used fixatives for HA detection: Bouin's Solution, Carnoy's Solution, Ethanol-Formalin-Glacial Acetic Acid (EFG), Histochoice, Modified Davidson's Solution, and 10% Neutral Buffered Formalin. Organs were harvested from CB6F1 mice and fixed with one of the identified fixatives. Fixed organs were sectioned, and the HABP assay was performed on sections in parallel. Hematoxylin and eosin staining was also performed to visualize tissue architecture. HABP signal localization and intensity varied between fixatives. EFG and Carnoy's Solution best preserved the HA signal intensity in the ovary and liver, showing HA localization in various sub-organ structures. In the kidney, only Modified Davidson's Solution was less than optimal. Our findings demonstrate that fixation can alter the ability to detect HA in tissue macro- and microstructures, as well as localization in a tissue-specific manner, in situ.

Keywords: extracellular matrix; hyaluronan binding protein assay; preservation—biological; staining/labeling.


Conflict of interest statement

Competing Interests: The author(s) declared no potential conflicts of interest with respect to the research, authorship, and/or publication of this article.

Figures

Figure 1.
Figure 1.
Hepatotoxin-induced hepatic hyaluronan production produces a robust positive control for the HABP assay. Carbon tetrachloride was injected into C57BL/6 mice and livers were collected 48 hr later and fixed using neutral buffered formalin (NBF). (A) The HABP assay revealed robust hyaluronan accumulation in the injured regions around hepatic central veins (asterisk) during the repair phase after carbon tetrachloride exposure. (B) Bovine testicular hyaluronidase treatment of serial sections prevented detection of hyaluronan. Scale bars are 200 μm. Abbreviation: HABP, Hyaluronan binding proteins.
Figure 2.
Figure 2.
Hematoxylin and eosin–stained whole ovary tissue sections reveal adequate tissue architecture preservation across fixatives. Representative H&E-stained images of whole ovary tissue sections fixed in (A) Bouin’s Solution (BS), (B) Carnoy’s Solution (CS), (C) Ethanol-Formalin-Glacial Acetic Acid (EFG), (D) Histochoice (HC), (E), Modified Davidson’s Solution (MDS), and (F) 10% Neutral Buffered Formalin (NBF). H&E staining was performed at the same time for all fixatives. Ovarian sub-structures such as early developing follicles (arrowhead), antral cavities of mature follicles (arrow), and corpora lutea (asterisk [*]) are indicated in each section. EFG and Carnoy’s Solution fixation resulted in more prominent eosinophilic staining as compared to other fixative conditions, as shown by pink staining. Scale bars are 400 μm.
Figure 3.
Figure 3.
Hematoxylin and eosin staining of ovarian tissue sections containing secondary follicles highlight differences in eosinophilic staining between fixatives. Representative H&E images of secondary follicles in ovarian tissue fixed in (A) Bouin’s Solution (BS), (B) Carnoy’s Solution (CS), (C) Ethanol-Formalin-Glacial Acetic Acid (EFG), (D) Histochoice (HC), (E) Modified Davidson’s Solution (MDS), and (F) 10% Neutral Buffered Formalin (NBF) reveal increased contrast due to greater eosinophilic staining in EFG and Carnoy’s Solution-fixed ovarian sections, as shown by pink staining (note that H&E staining occurred concurrently ovary sections from all fixatives). Further, sub-follicular structures such as the oocyte (asterisk [*]) and theca cells (insets, arrowhead), which surround growing follicles and produce steroid hormones, are preserved across all fixation conditions. Scale bars are 100 μm.
Figure 4.
Figure 4.
Ethanol-Formalin-Glacial Acetic Acid, Carnoy’s Solution, and Bouin’s Solution produce optimal HABP signal at low magnification in the ovary. Representative images of HABP-stained ovarian tissue fixed in (A) Bouin’s Solution (BS), (B) Carnoy’s Solution (CS), (C) Ethanol-Formalin-Glacial Acetic Acid (EFG), (D) Histochoice (HC), (E) Modified Davidson’s Solution (MDS), and (F) 10% Neutral Buffered Formalin (NBF). For all images, DNA is shown in blue and HA is shown in green. HA shows greatest localization in the follicular fluid of antral follicles (arrow) as well as in the layer of theca cells immediately surrounding growing follicles (arrowhead). Fixation with EFG, Carnoy’s Solution, and Bouin’s Solution produced greater HA signal brightness. Negative controls showing sections treated with bovine testicular hyaluronidase, which degrades HA and abrogates HABP signal, are shown in the insets. Scale bars are 400 μm.
Figure 5.
Figure 5.
Ethanol-Formalin-Glacial Acetic Acid and Carnoy’s Solution produce superior HA localization preservation in the theca cell layer surrounding ovarian follicles. Representative images of HABP-stained ovarian tissue fixed in (A) Bouin’s Solution (BS), (B) Carnoy’s Solution (CS), (C) Ethanol-Formalin-Glacial Acetic Acid (EFG), (D) Histochoice (HC), (E) Modified Davidson’s Solution (MDS), and (F) 10% Neutral Buffered Formalin (NBF). For all images, DNA is shown in blue and HA is shown in green. Both EFG and Carnoy’s Solution fixation best preserve and detect HA localization to the theca layer of cells surrounding growing follicles (arrows). Scale bars are 200 μm.
Figure 6.
Figure 6.
Fixation with Bouin’s Solution, Carnoy’s Solution, and Ethanol-Formalin-Glacial Acetic Acid produce eosinophilic staining in whole kidney sections. Low power representative images from cross-sectioned kidneys stained with H&E, at the same time, following fixation in (A) Bouin’s Solution (BS), (B) Carnoy’s Solution (CS), (C) Ethanol-Formalin-Glacial Acetic Acid (EFG), (D) Histochoice (HC), (E) Modified Davidson’s Solution (MDS), and (F) 10% Neutral Buffered Formalin (NBF). Kidney regions such as cortex, outer stripe of the outer medulla, inner stripe of the outer medulla, and inner medulla are best seen with EFG fixation. However, the cortex and the medulla can be distinguished from one another in sections fixed with Bouin’s Solution, Carnoy’s Solution, or Histochoice. Among different fixatives, Bouin’s Solution, Carnoy’s Solution, and EFG produced more intense eosinophilic staining. Scale bars are 400 μm.
Figure 7.
Figure 7.
Acceptable quality of hematoxylin and eosin staining in kidney tissue across fixative conditions despite variations in eosinophilic staining. Shown are representative H&E images of kidney cortex and medulla tissue fixed in (A, G) Bouin’s Solution (BS), (B, H) Carnoy’s Solution (CS), (C, I) Ethanol-Formalin-Glacial Acetic Acid (EFG), (D, J) Histochoice (HC), (E, K) Modified Davidson’s Solution (MDS), and (F, L) 10% Neutral Buffered Formalin (NBF). All staining was performed at the same time. While fixation with Bouin’s Solution, Carnoy’s Solution, and EFG intensified eosinophilic staining, the quality of H&E staining was overall acceptable across different fixatives allowing preservation of different structures in the kidney. For example, glomeruli (G, asterisk [*]), proximal convoluted tubules (PT, arrowhead), and distal convoluted tubules (DT, hash sign [#]) are indicated. Scale bars are 100 μm.
Figure 8.
Figure 8.
Kidney hyaluronan localization is least sensitive to fixative choice. Representative images of HABP-stained kidney tissue following fixation in (A, G) Bouin’s Solution (BS), (B, H) Carnoy’s Solution (CS), (C, I) Ethanol-Formalin-Glacial Acetic Acid (EFG), (D, J) Histochoice (HC), (E, K) Modified Davidson’s Solution (MDS), and (F, L) 10% Neutral Buffered Formalin (NBF). For all images, DNA is shown in blue and HA is shown in green. All fixatives consistently preserved and allowed for HA detection in kidney tissue, although HA signal was weakest with Modified Davidson’s Solution fixation. Specifically, kidney cortex showed HA localization limited to the periarteriolar space while there was diffuse interstitial HA signal in the medullary region. Arrows indicate cortical HA-positive periarteriolar regions. Negative controls showing sections treated with bovine testicular hyaluronidase are shown in insets. Scale bars are 20 μm. Abbreviations: HABP, Hyaluronan binding proteins; HA, hyaluronan.
Figure 9.
Figure 9.
Hematoxylin and eosin-stained whole liver tissue sections reveal optimal tissue architecture preservation after fixation in Bouin’s Solution, Carnoy’s Solution, and Ethanol-Formalin-Glacial Acetic Acid. H&E staining (performed at the same time for all fixatives) was used to evaluate healthy liver tissue architecture after fixing in (A) Bouin’s Solution (BS), (B) Carnoy’s Solution (CS), (C) Ethanol-Formalin-Glacial Acetic Acid (EFG), (D) Histochoice (HC), (E) Modified Davidson’s Solution (MDS), and (F) 10% Neutral Buffered Formalin (NBF). Carnoy’s Solution best preserved liver tissue architecture, while Bouin’s Solution and EFG also sufficiently preserved liver tissue. Asterisks (*) indicate fixation/processing artifacts (D, E). Scale bars are 400 μm.
Figure 10.
Figure 10.
Ethanol-Formalin-Glacial Acetic Acid and Carnoy’s Solution fixation produce superior HA preservation in the peribiliary regions of liver tissue. H&E staining (left) and the HABP assay (right) were used to compare the microanatomical architecture of the hepatic portal triad with HA localization and intensity in normal mouse livers fixed with (A, G) Bouin’s Solution (BS), (B, H) Carnoy’s Solution (CS), (C, I) Ethanol-Formalin-Glacial Acetic Acid (EFG), (D, J) Histochoice (HC), (E, K) Modified Davidson’s Solution (MDS), and (F, L) 10% Neutral Buffered Formalin (NBF). DNA is shown in blue and HA is shown in green, and areas showing brightest HA signal are indicated with arrows. Negative controls showing sections treated with bovine testicular hyaluronidase are found as insets. Scale bars are 20 µm.

Similar articles

Cited by

References

    1. Fraser JR, Laurent TC, Laurent UB. Hyaluronan: its nature, distribution, functions and turnover. J Intern Med. 1997;242:27–33. - PubMed
    1. Knudson CB, Knudson W. Cartilage proteoglycans. Semin Cell Dev Biol. 2001;12:69–78. - PubMed
    1. Kultti A, Li X, Jiang P, Thompson CB, Frost GI, Shepard HM. Therapeutic targeting of hyaluronan in the tumor stroma. Cancers (Basel). 2012;4:873–903. - PMC - PubMed
    1. Engström PE, Shi XQ, Tronje G, Larsson A, Welander U, Frithiof L, Engstrom GN. The effect of hyaluronan on bone and soft tissue and immune response in wound healing. J Periodontol. 2001;72:1192–200. - PubMed
    1. Cheung WF, Cruz TF, Turley EA. Receptor for hyaluronan-mediated motility (RHAMM), a hyaladherin that regulates cell responses to growth factors. Biochem Soc Trans. 1999;27:135–42. - PubMed

Publication types

Substances

LinkOut - more resources