. 2020 May;39(5):1501-1510.
doi: 10.1109/TMI.2019.2951080. Epub 2019 Nov 6.

Toblerone: Surface-Based Partial Volume Estimation

Toblerone: Surface-Based Partial Volume Estimation

Thomas F Kirk et al. IEEE Trans Med Imaging. 2020 May.

Abstract

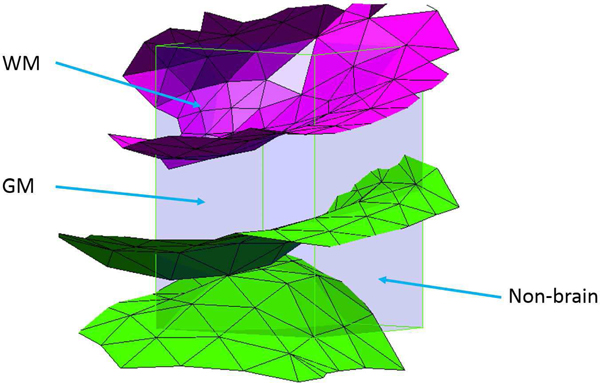
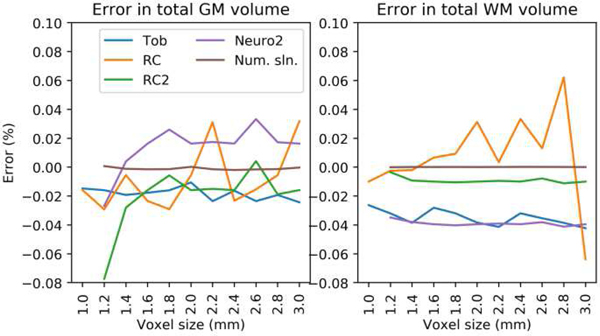
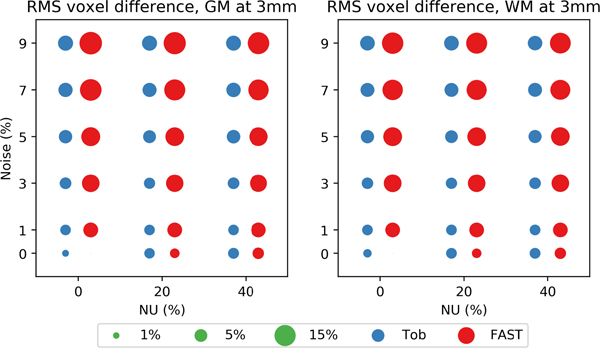
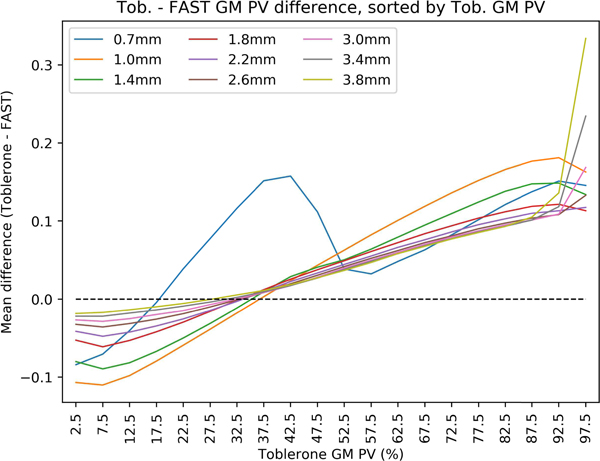
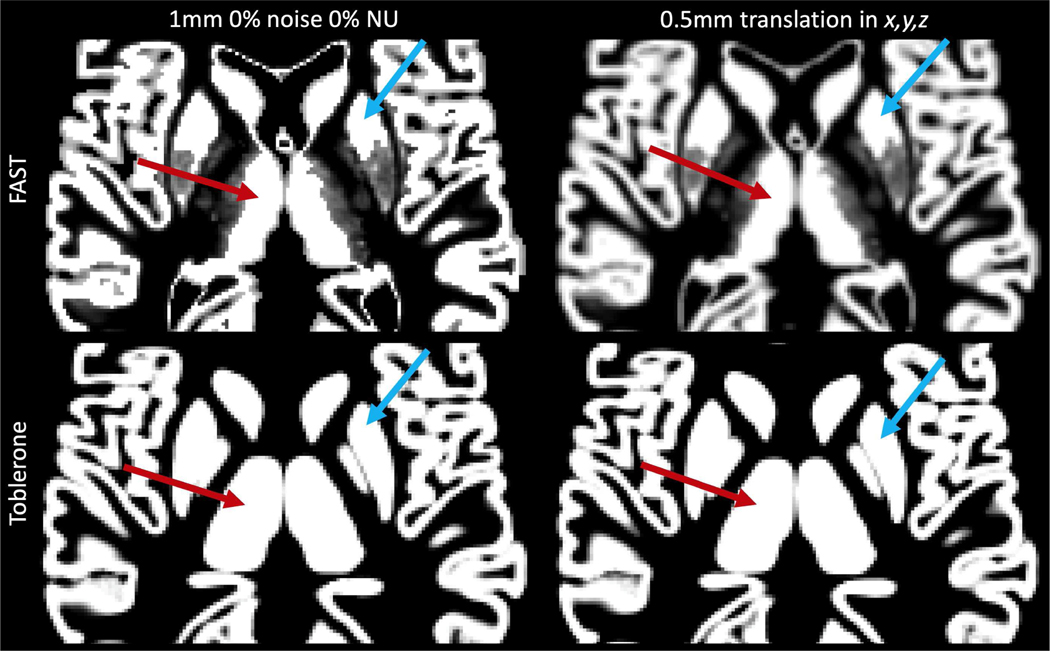
Partial volume effects (PVE) present a source of confound for the analysis of functional imaging data. Correction for PVE requires estimates of the partial volumes (PVs) present in an image. These estimates are conventionally obtained via volumetric segmentation, but such an approach may not be accurate for complex structures such as the cortex. An alternative is to use surface-based segmentation, which is well-established within the literature. Toblerone is a new method for estimating PVs using such surfaces. It uses a purely geometric approach that considers the intersection between a surface and the voxels of an image. In contrast to existing surface-based techniques, Toblerone is not restricted to use with any particular structure or modality. Evaluation in a neuroimaging context has been performed on simulated surfaces, simulated T1-weighted MRI images and finally a Human Connectome Project test-retest dataset. A comparison has been made to two existing surface-based methods; in all analyses Toblerone's performance either matched or surpassed the comparator methods. Evaluation results also show that compared to an existing volumetric method (FSL FAST), a surface-based approach with Toblerone offers improved robustness to scanner noise and field non-uniformity, and better inter-session repeatability in brain volume. In contrast to volumetric methods, a surface-based approach negates the need to perform resampling which is advantageous at the resolutions typically used for neuroimaging.


Figures

Fig. 1.
Fig. 1.
Reduced ray intersection test for non-contiguous surfaces. The root point (interior) is shown in magenta. A ray from an interior point (green) makes two intersections due to the presence of a fold; from an exterior point (yellow) there is one intersection.
Fig. 2.
Fig. 2.
Intersection of inner (magenta) and outer (green) surfaces of the cortex with a voxel. The outer surface intersects twice with distinct patches of surface; this is likely due to the presence of a sulcus. Tissue PVs are labelled.
Fig. 3.
Fig. 3.
Various subvoxel/surface configurations. a) no intersection: whole-volume assignment; b) single intersection through one face: a small convex hull will be formed; c/d) two examples of single intersection, folded surface: further subdivision will be used; e) single intersection through multiple faces: a convex hull will be formed; f) multiple surface intersection (unconnected patches of surface, likely a sulcus): further subdivision will be used.
Fig. 4.
Fig. 4.
a) Simulated surfaces; b) cutaway showing inner (red) and outer (green) surfaces. Peak radial distance between the two was 3mm.
Fig. 5.
Fig. 5.
Simulated surfaces: error in total tissue volume. Toblerone showed consistency, though with small bias, for both GM and WM. RC1 errors were lower for GM than WM. Resampling-based methods (RC2, Neuro2) showed particular consistency in WM. [Full results in supplementary, fig. s5]
Fig. 6.
Fig. 6.
Simulated surfaces: per-voxel error. Toblerone and RC produced the lowest errors in GM; in WM there was a clear difference to Toblerone. RC2 and Neuro2’s errors both decreased with increasing voxel size, with a characteristic notch observed at 2mm. [Full results in supplementary, fig. s6]
Fig. 7.
Fig. 7.
BrainWeb: difference in total tissue volume referenced to each method’s 0% noise 0% NU result. Surface-based methods were more consistent at almost all noise and NU levels; FAST was more consistent in GM than WM.
Fig. 8.
Fig. 8.
BrainWeb: RMS per-voxel differences at 3mm voxel size, referenced to each method’s 1mm 0% noise 0% NU results. Toblerone’s differences were smaller at almost all levels of noise and NU, as was also the case at other voxel sizes. [Results for other voxel sizes are given in supplementary fig. s8]
Fig. 9.
Fig. 9.
HCP test-retest: mean difference between Toblerone and FAST GM PVs, sorted into 5% width bins according to Toblerone’s GM PV. As Toblerone’s GM PV estimate in a given voxel increased, FAST was more likely to assign a smaller value, and vice-versa. The strength of this relationship decreased with increasing voxel size. An inverse, but weaker, effect was seen for WM (supplementary fig s9).
Fig. 10.
Fig. 10.
HCP test-retest: inter-session (retest minus test) difference in total tissue volume. PVs were estimated in the native 0.7mm isotropic space of the structural images. RC’s result is for the cortex only. Both surface methods show a tighter distribution than FAST.
Fig. 11.
Fig. 11.
Simulated surfaces: error induced by resampling the ground truth GM PV map, masked to voxels intersecting either surface of the cortex. As the input voxel size increases, error increases, but as the ratio output / input voxel size increases, error falls. Finally, error falls to zero when the ratio takes an integer value.
Fig. 12.
Fig. 12.
Illustration of resampling-induced blurring on the 1mm isotropic GM PV map from the 0% noise 0% NU BrainWeb image. The left column shows the original estimates produced by FAST and Toblerone, the right shows the result of a 0.5mm translation along each axis. The left thalamus (red) and right putamen (blue) are highlighted in each, showing how surface and volumetric methods differ markedly in their interpretation of subcortical structures (FAST does not regard them as pure GM, whereas Toblerone does for the analyses presented in this work).

References

    1. Fischl B. and Dale AM, “Measuring the thickness of the human cerebral cortex from magnetic resonance images,” Proc. Natl. Acad. Sci, vol. 97, no. 20, pp. 11050 LP – 11055, September 2000. - PMC - PubMed
    1. Müller-Gärtner HW, Links JM, Prince JL, Bryan RN, McVeigh E, Leal JP, Davatzikos C, and Frost JJ, “Measurement of Radiotracer Concentration in Brain Gray Matter Using Positron Emission Tomography: MRI-Based Correction for Partial Volume Effects,” J. Cereb. Blood Flow Metab, vol. 12, no. 4, pp. 571–583, July 1992. - PubMed
    1. Asllani I, Borogovac A, and Brown TR, “Regression algorithm correcting for partial volume effects in arterial spin labeling MRI,” Magn. Reson. Med, vol. 60, no. 6, pp. 1362–1371, September 2008. - PubMed
    1. Chappell MA, Groves AR, MacIntosh BJ, Donahue MJ, Jezzard P, and Woolrich MW, “Partial volume correction of multiple inversion time arterial spin labeling MRI data,” Magn. Reson. Med, vol. 65, no. 4, pp. 1173–1183, 2011. - PubMed
    1. Shattuck DW, Sandor-Leahy SR, Schaper KA, Rottenberg DA, and Leahy RM, “Magnetic resonance image tissue classification using a partial volume model,” Neuroimage, vol. 13, no. 5, pp. 856–876, 2001. - PubMed

Publication types