. 2020 Feb 3;130(2):904-920.
doi: 10.1172/JCI130767.

Human autologous iPSC-derived dopaminergic progenitors restore motor function in Parkinson's disease models

Affiliations

Human autologous iPSC-derived dopaminergic progenitors restore motor function in Parkinson's disease models

Bin Song et al. J Clin Invest. .

Abstract

Parkinson's disease (PD) is a neurodegenerative disorder associated with loss of striatal dopamine, secondary to degeneration of midbrain dopamine (mDA) neurons in the substantia nigra, rendering cell transplantation a promising therapeutic strategy. To establish human induced pluripotent stem cell-based (hiPSC-based) autologous cell therapy, we report a platform of core techniques for the production of mDA progenitors as a safe and effective therapeutic product. First, by combining metabolism-regulating microRNAs with reprogramming factors, we developed a method to more efficiently generate clinical-grade iPSCs, as evidenced by genomic integrity and unbiased pluripotent potential. Second, we established a "spotting"-based in vitro differentiation methodology to generate functional and healthy mDA cells in a scalable manner. Third, we developed a chemical method that safely eliminates undifferentiated cells from the final product. Dopaminergic cells thus express high levels of characteristic mDA markers, produce and secrete dopamine, and exhibit electrophysiological features typical of mDA cells. Transplantation of these cells into rodent models of PD robustly restores motor function and reinnervates host brain, while showing no evidence of tumor formation or redistribution of the implanted cells. We propose that this platform is suitable for the successful implementation of human personalized autologous cell therapy for PD.

Keywords: Neuroscience; Parkinson’s disease; Stem cell transplantation; Stem cells.


Conflict of interest statement

Conflict of interest: The authors have declared that no conflict of interest exists.

Figures

Figure 1
Figure 1. An improved reprogramming method combining Y4F and metabolism-regulating miRNAs.
(AD) Screening of miRNAs that enhance the generation of hiPSC-like colonies by Y3F (A), Y4F (B), Y3F+3 (C), or Y4F+3 (D) from hDFs, relative to an empty vector (mock) control. Mean ± SD. n = 5. *P < 0.05; **P < 0.01, 1-way ANOVA with Tukey’s post test. (E and F) Time course of OCR (E) and ECAR (F) in hDFs infected with Y4F, miR-302s, and/or miR-200c. Mean ± SD. n = 3. *P < 0.05; **P < 0.01; ***P < 0.005, 2-way ANOVA with Tukey’s post test. (G) Percentage of TRA-1-60+ colonies among AP+ colonies following lentiviral infection encoding Y4F, Y4F+3, or Y4F+3+2. Mean ± SD. n = 6. ***P < 0.005, 2-way ANOVA with Tukey’s post test. (H) Percentage of TRA-1-60+ colonies among AP+ colonies following transfection with episomal vectors encoding Y4F, Y4F+3, or Y4F+3+2. Mean ± SD. n = 4. **P < 0.01, 2-way ANOVA with Tukey’s post test.
Figure 2
Figure 2. Higher quality hiPSC lines generated from our improved reprogramming method.
(A) Heatmaps depicting gene expression levels of pluripotency markers among established hiPSC lines compared with the original hDFs and an hESC line (H9). n = 3. (B) Immunostaining of hiPSC lines generated by different combinations with specific antibodies against pluripotency markers (e.g., OCT4, NANOG, TRA-1-60, and SOX2) along with Hoechst 33342 nuclear staining (insets). Scale bars: 100 μm. (C) Immunostaining for lineage-specific markers for ectoderm (OTX2), mesoderm (BRACHYURY), and endoderm (SOX17) following spontaneous differentiation for 7 days. Scale bars: 100 μm. (D) Heatmaps depicting gene expression levels of early differentiation markers of ectoderm (PAX6 and MAP2), endoderm (FOXA2, SOX17, and CK8), and mesoderm markers (MSX1, MYL2A, and COL6A2) in hiPSC lines generated by pY4F, pY4F+3, or pY4F+3+2. n = 2.
Figure 3
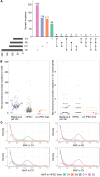
Figure 3. Genomic integrity of hiPSC lines generated from skin biopsy of a sporadic PD patient.
(A) Somatic mutations found in 4 hiPSC lines. Columns show the number of singleton mutations in each hiPSC line (different colors per hiPSC line) and number of unique mutations found in 2 or more hiPSC lines (black columns). Below black columns, hiPSC lines sharing the mutations are indicated by dots connected with edges. Bottom left bars represent total numbers of mutations including both singleton and those found in 2 or more hiPSC lines. C4 had the smallest number of somatic mutations (n = 92), of which 80 were singleton and 12 were found in C4 and the other hiPSC lines. (B) Mutational burdens on coding regions and cancer-associated genes were compared with publicly available data sets. The numbers of nonsynonymous mutations in our hiPSC lines were significantly lower than for hESC lines. On average, the numbers of nonsynonymous mutations in the iPSC lines from the HipSci project (28) are similar to those of our hiPSC lines. Overall, C4 shows the lowest mutation burden (red). For the somatic mutations in cancer-associated genes, no somatic mutation was found in 2 widely used hESC lines (H1 and H9, blue) and C4 hiPSC line (red) (right panel). (C) Distribution of minor allelic fractions (MAFs) of all somatic mutations in the 4 hiPSC lines. The peaks around MAF of 0.5 denote clonal somatic mutations. The second peaks with lower MAFs of 0.1 denote subclonal mutations. For each plot, the density curve with 2 peaks shows the distribution of somatic mutation MAFs. The colors of curves match with those in A for each hiPSC line. Curves with different colors (peaked around MAF of 0.0) indicate somatic mutations detected by the other hiPSC lines.
Figure 4
Figure 4. Spotting-based in vitro differentiation improves yield and quality of the resulting DA cells.
(A) Experimental schematic to find optimized physical culture conditions. On d0 through d15, all cells regardless of viability were quantified by FACS and/or manual cell counting, as marked with arrows. At d15, cells were replated on cover glass for immunocytochemical analysis or harvested for qRT-PCR. (B and C) Comparison between conventional monolayer-based and spotting-based methods for degree of cell loss (due to detachment) from d1 to d14 and cell harvest on d15 (B) and for the percentage of dead cells at d15 (C) for both hESC (H9 and H7) and hiPSC (C4 and N3). Cell densities of 11,000/cm2 and 10,000/spot were used for conventional and spotting-based methods, respectively. Data presented reflect experiments with measurable outcomes (see the legend of Supplemental Figure 5A). Mean ± SD. n = 4. One-way ANOVA. (D) Quantification of dying cells from final cell harvest on d15 using immunocytochemical analysis. Antibody against cleaved caspase-3 was used to detect apoptotic cells. Nuclear condensation was visualized by Hoechst 33342 staining to detect dead or dying cells. Cells plated with spotting technique showed significantly reduced numbers of cleaved caspase-3–positive cells. Scale bars: 100 μm. Scale bar (insets): 50 μm.
Figure 5
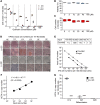
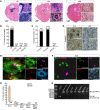
Figure 5. Effects of quercetin treatment on undifferentiated and differentiated cells.
(A) Screening to determine optimal quercetin treatment conditions. Surviving hiPSCs were counted using a hemocytometer after treatment with different quercetin concentrations and durations. (B and C) Viability (B) and total cell number (C) of dopaminergic cells at d11 after quercetin treatment on d9. Cultures were treated for 16 hours at 5, 10, 20, 40, and 100 μM. Mean ± SD. n = 4. One-way ANOVA. (D) Colony formation by hiPSCs serially diluted by factors of 10 from 105 to 1 together with a constant number of fibroblasts (105). Cells were treated with 40 μM quercetin for 16 hours or left untreated, and then cultured for 6 days, followed by staining for AP activity. Representative results from 2 separate experiments. (E) Plotting of final colony number counted against original input hiPSC number. (F) Generation of standard curve for OCT4 copy number against input hiPSC number by qRT-PCR. OCT4 copy number was measured by qRT-PCR and calculated from 10-fold serially diluted hiPSCs, from 105 to 102 cells. (G) Measurement using OCT4 qRT-PCR of OCT4-positive cell numbers among mDA cells differentiated from hiPSCs at various time points with or without quercetin treatment. Mean ± SD. n = 2. ***P < 0.005, 2-way ANOVA.
Figure 6
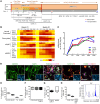
Figure 6. Molecular, cellular, and physiological characterization of in vitro–differentiated C4 hiPSCs.
(A) Schematic overview of mDA differentiation method based on spotting protocol. Numbers represent concentrations in ng/ml, and those in parentheses show μM. AA, ascorbic acid; β-mer, β-mercaptoethanol; BDNF, brain-derived neurotrophic factor; CHIR, CHIR99021; dbcAMP, dibutyryl cyclic adenosine monophosphate; FGF8, fibroblast growth factor 8; GDNF, glial cell line–derived neurotrophic factor; KSR, knockout serum replacement; LDN, LDN193189; L-Glu, l-glutamine; NEAA, nonessential amino acid; PMN, purmorphamine; QC, quercetin; SB, SB431542; SHH, sonic hedgehog. (B) Heatmap of gene expression of stage-specific neural markers in mDA-differentiated cells. (C) Gradual increase in FOXA2, LMX1A, NURR1, and TH gene expression during differentiation. (D) Immunofluorescence staining of neural precursor marker (NESTIN), mDAP markers (FOXA2/LMX1A/TH), mDAN markers (MAP2, NURR1/TH), and proliferating marker (PAX6/SOX1/KI67) cells in differentiated d28 cells. Scale bars: 100 μm. (E) Percentages of NESTIN+, MAP2+, TH+, and NURR1+ cells among total d28 cells (n = 6). (F) Percentages of FOXA2+, LMXA1+, and FOXA2+LMX1A+cells among total d28 cells (n = 6). (G) Percentages of FOXA2+LMX1A+, NURR1+ cells among TH+ d28 cells (n = 6). (H) Percentages of PAX6+, SOX1+, and PAX6+SOX1+KI67+ cells among total d28 cells (n = 6). (I) HPLC analysis of KCl-induced release of DA and DA metabolites (DOPAC) on d47. Data are presented as mean ± SEM.
Figure 7
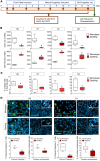
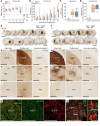
Figure 7. In vivo safety of C4-derived mDA cells in NOD SCID mice.
(A) H&E staining of NOD SCID mouse brain after striatal transplantation of C4 iPS cells (d0, left), or of C4-derived mDAPs at d14 (middle) or d28 (right). The white circle in the d14 group identifies rosette-like structures. (B) Quantification of teratoma formation percentage at d0 (n = 4) and d14 without quercetin (n = 4) and at d14 (n = 19) and d28 (n = 23) with quercetin treatment groups. (C) Quantification of rosette formation at d14 of differentiation without quercetin and at d14 and d28 with quercetin treatment. (D) Immunohistochemistry of vimentin in d14 and d28 groups. (E and F) Immunofluorescence staining of SOX1, PAX6, and KI67 in d14 (E) and d28 groups (F). (G) Quantification of SOX1+, KI67+, SOX1+KI67+, SOX1+PAX6+, SOX1+PAX6+KI67+ populations in d14 and d28 groups. Data are presented as mean ± SEM. n = 4. ***P < 0.001, Student’s t test. (H) Biodistribution assay. RT-PCR of human- or mouse-specific gene expression in “brain mix” (mixture of olfactory bulb and cerebellum), spinal cord, lung, heart, spleen, kidney, and liver of the NOD SCID mice that had received intrastriatal hiPSC-derived d28 dopaminergic progenitor grafts 6 months previously. hiPSC serves as a positive control. The human-specific gene is located on chromosome 10 at 29125650 to 29125967. The mouse-specific gene is part of mouse TNF-α. Scale bars: 100 μm (unless otherwise specified).
Figure 8
Figure 8. In vivo survival and function of C4 hiPSC-derived mDA cells.
(AD) Behavioral assessments using drug-induced rotation test (A), corridor test (B), cylinder test (C), and stepping test (D) in d28 and Cryo-d28 groups (n = 9). (E and F) Overview of graft-derived hNCAM+ innervation and TH+ innervation of the host brain. (GL) Innervation by graft-derived hNCAM+ neurons (GI) or TH+ neurons (JL) into host STR, NAc, and PFC of intact side, grafted side, and lesioned ungrafted side. (M) High magnification image showing graft-derived innervation. (N) Immunofluorescence staining of the human-specific synaptic marker SYP, TH, and DARPP32 in grafted neurons. All graft analysis data (EM) were obtained 26 weeks after transplantation. AC, anterior commissure; dl-STR, dorsal STR. Data are presented as mean ± SEM. *P < 0.05; **P < 0.01; ***P < 0.001, Student’s t test. Scale bars: 500 μm (GL); 100 μm (M and N); and 20 μm for insets in N.

Comment in

References

    1. de Lau LM, Breteler MM. Epidemiology of Parkinson’s disease. Lancet Neurol. 2006;5(6):525–535. doi: 10.1016/S1474-4422(06)70471-9. - DOI - PubMed
    1. Kang UJ, Fahn S. Management of tardive dyskinesia. Ration Drug Ther. 1988;22(8):1–7. - PubMed
    1. Bjorklund A, Kordower JH. Cell therapy for Parkinson’s disease: what next? Mov Disord. 2013;28(1):110–115. doi: 10.1002/mds.25343. - DOI - PubMed
    1. Kefalopoulou Z, et al. Long-term clinical outcome of fetal cell transplantation for Parkinson disease: two case reports. JAMA Neurol. 2014;71(1):83–87. doi: 10.1001/jamaneurol.2013.4749. - DOI - PMC - PubMed
    1. Barker RA, Drouin-Ouellet J, Parmar M. Cell-based therapies for Parkinson disease—past insights and future potential. Nat Rev Neurol. 2015;11(9):492–503. doi: 10.1038/nrneurol.2015.123. - DOI - PubMed

Publication types