. 2020 Jan 2;130(1):507-522.
doi: 10.1172/JCI131116.

Defective glycosylation and multisystem abnormalities characterize the primary immunodeficiency XMEN disease

Affiliations

Defective glycosylation and multisystem abnormalities characterize the primary immunodeficiency XMEN disease

Juan C Ravell et al. J Clin Invest. .

Abstract

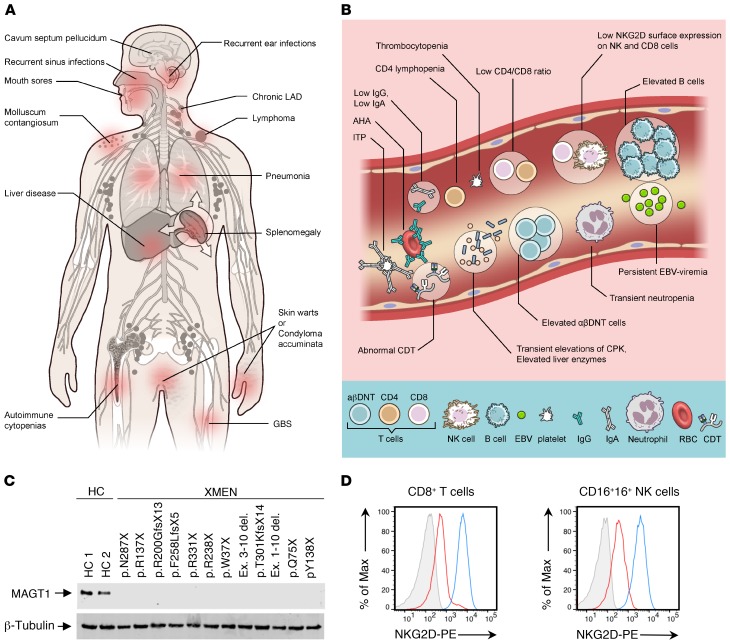
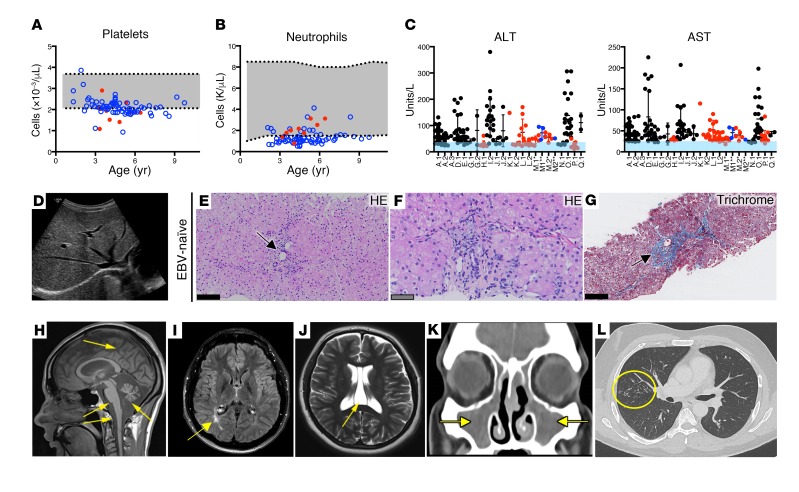
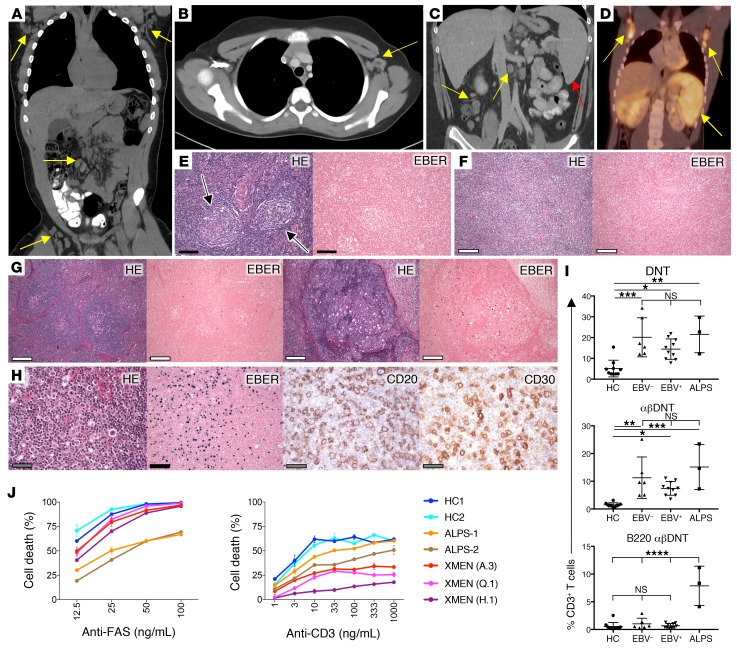
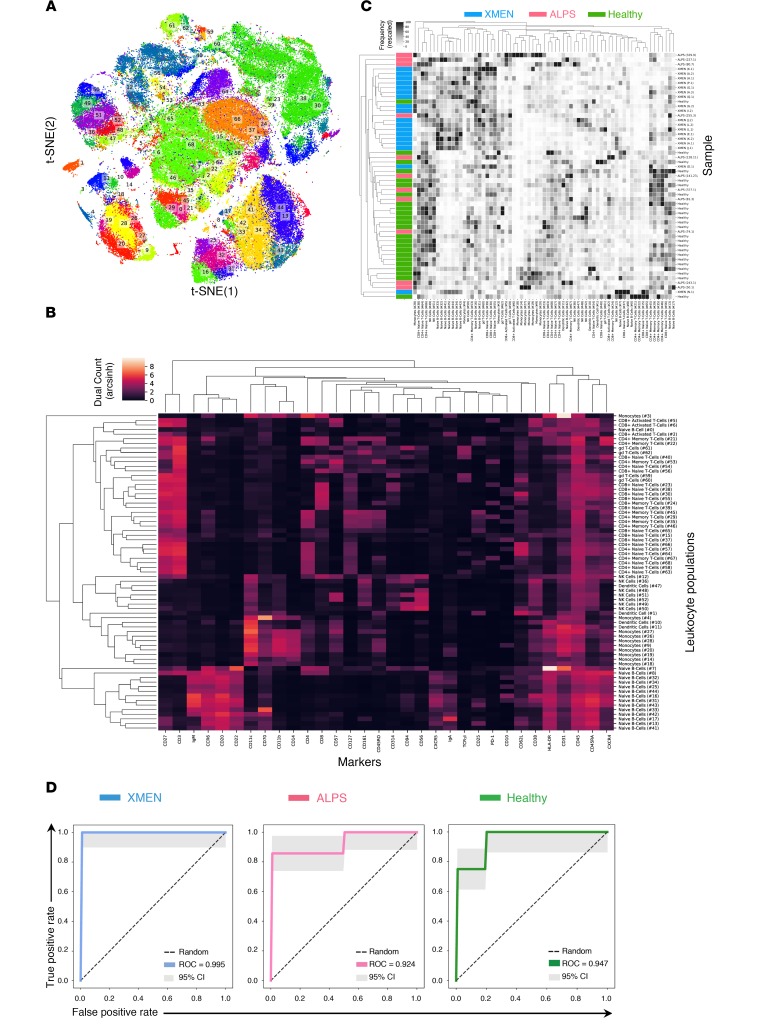
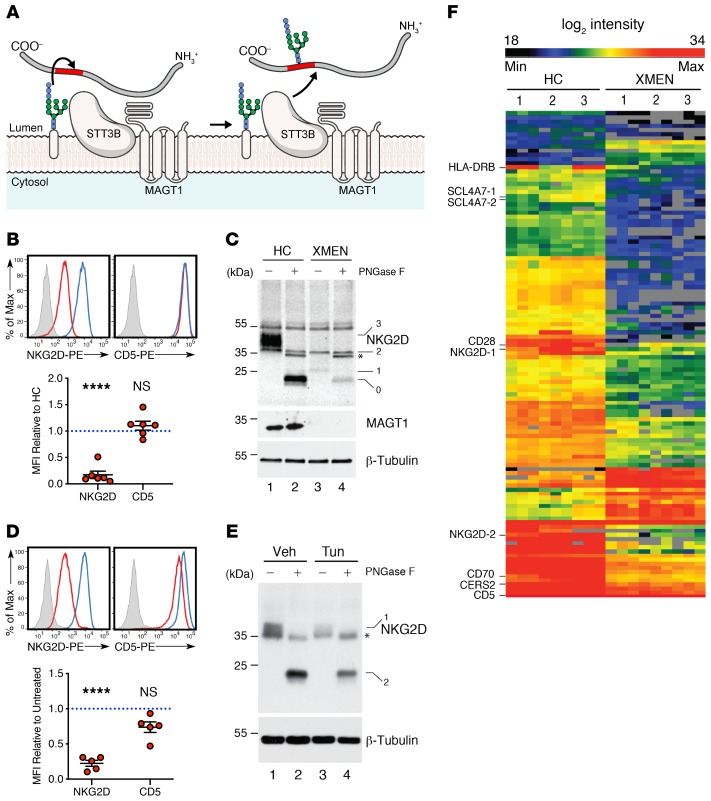
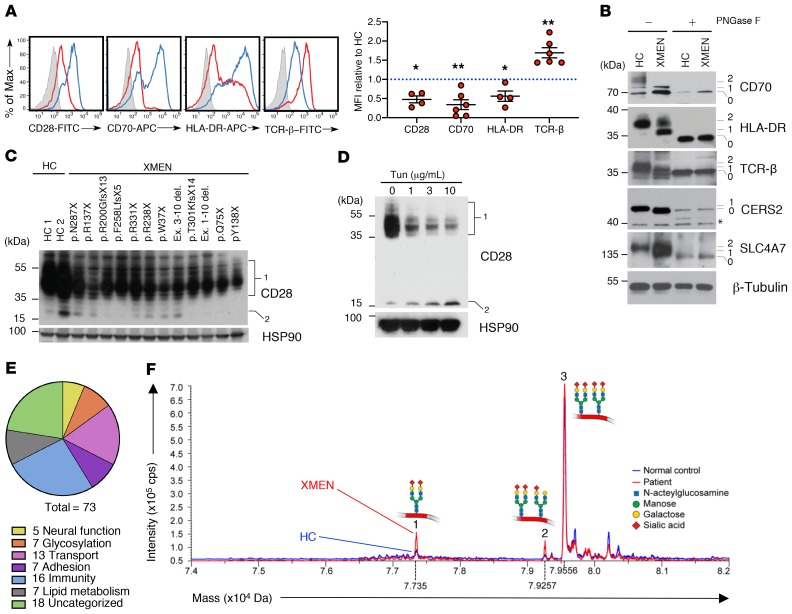
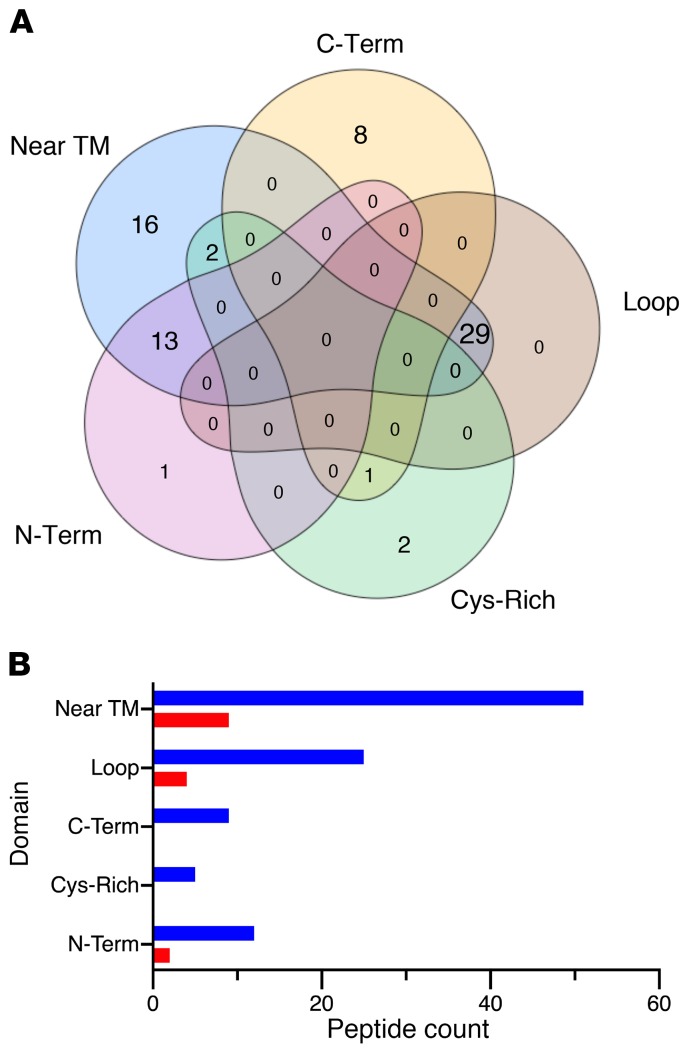
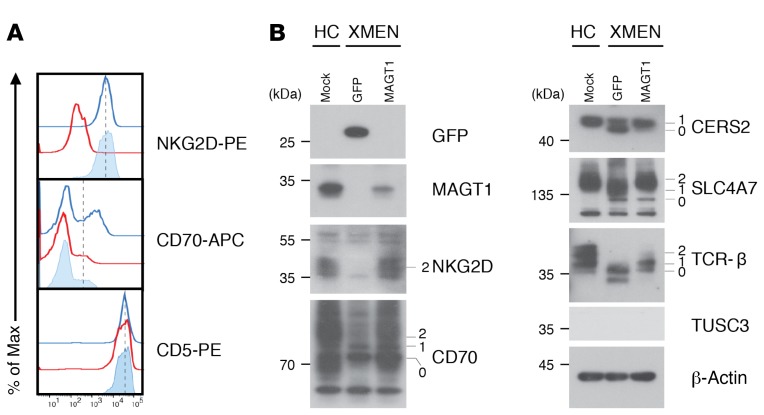
X-linked immunodeficiency with magnesium defect, EBV infection, and neoplasia (XMEN) disease are caused by deficiency of the magnesium transporter 1 (MAGT1) gene. We studied 23 patients with XMEN, 8 of whom were EBV naive. We observed lymphadenopathy (LAD), cytopenias, liver disease, cavum septum pellucidum (CSP), and increased CD4-CD8-B220-TCRαβ+ T cells (αβDNTs), in addition to the previously described features of an inverted CD4/CD8 ratio, CD4+ T lymphocytopenia, increased B cells, dysgammaglobulinemia, and decreased expression of the natural killer group 2, member D (NKG2D) receptor. EBV-associated B cell malignancies occurred frequently in EBV-infected patients. We studied patients with XMEN and patients with autoimmune lymphoproliferative syndrome (ALPS) by deep immunophenotyping (32 immune markers) using time-of-flight mass cytometry (CyTOF). Our analysis revealed that the abundance of 2 populations of naive B cells (CD20+CD27-CD22+IgM+HLA-DR+CXCR5+CXCR4++CD10+CD38+ and CD20+CD27-CD22+IgM+HLA-DR+CXCR5+CXCR4+CD10-CD38-) could differentially classify XMEN, ALPS, and healthy individuals. We also performed glycoproteomics analysis on T lymphocytes and show that XMEN disease is a congenital disorder of glycosylation that affects a restricted subset of glycoproteins. Transfection of MAGT1 mRNA enabled us to rescue proteins with defective glycosylation. Together, these data provide new clinical and pathophysiological foundations with important ramifications for the diagnosis and treatment of XMEN disease.

Keywords: Genetic diseases; Glycobiology; Immunology; Proteoglycans.


Conflict of interest statement

Conflict of interest: The authors have declared that no conflict of interest exists.

Figures

Figure 1
Figure 1. Clinical, laboratory, and genetic findings in XMEN disease.
Clinical manifestations (A) and laboratory findings (B) in XMEN disease. AHA, autoimmune hemolytic anemia (AHA); ITP, immune thrombocytopenic purpura. (C) Immunoblot showing MAGT1 and β-tubulin proteins in T cell blasts from HCs (HC 1 and HC 2) and patients with XMEN with the indicated mutations. (D) NKG2D expression on CD8+ T cells and NK cells from HCs (blue), patients with XMEN (red), and an isotype control (gray).
Figure 2
Figure 2. Multisystem abnormalities in XMEN disease.
Platelet (A) and absolute neutrophil (B) counts for an EBV-naive (red) patient and an EBV-positive (blue) patient with a normal range (gray) and patients’ age. (C) ALT and AST levels in EBV-naive (black), EBV-infected (red), and EBV-naive patients who became EBV infected (blue) with a normal range (light blue) and patients’ identities (shown on the x axis). (D) Increased hepatic echogenicity in liver ultrasound from an EBV-naive patient. (E and F) H&E-stained (HE) liver biopsy from an EBV-naive patient showing mild focal portal chronic inflammatory infiltrates (black arrow) without interface hepatitis and hepatocytes with pale cytoplasm. (G) Masson’s trichrome–stained image of liver biopsy sample from the same EBV-naive patient shows periportal fibrosis (black arrow). (H) T1-weighted MRI demonstrating severe diffuse atrophy of the cerebrum, cerebellum, brainstem, and spinal cord (yellow arrows). (I) T2 fluid-attenuated inversion recovery (FLAIR) brain MRI showing occipital leukomalacia (yellow arrow). (J) T2-weighted brain MRI demonstrating CSP (yellow arrow). (K) CT scan of paranasal sinuses showing opacification of the maxillary sinuses (yellow arrows) in a patient with bacterial sinusitis. (L) CT scan showing extensive tree-in-bud nodular infiltrates in the right lung (yellow circle) in a patient with longstanding hypogammaglobulinemia. (EG) Scale bars: 50 μm (gray) and 100 μm (black).
Figure 3
Figure 3. Lymphoproliferation in XMEN disease.
(A) CT scan of chest, abdomen, and pelvis depicting bilateral axillary, mesenteric, and inguinal LAD in an EBV-infected patient (yellow arrows). (B) Contrast-enhanced CT scan of the chest showing axillary LAD (yellow arrow) in an EBV-naive patient. (C) Contrast-enhanced CT scan of the abdomen depicting splenomegaly (red arrow) and mesenteric LAD (yellow arrows) in an EBV-infected patient. (D) FDG-PET scan of a patient with XMEN and EBV-positive LPD showing hypermetabolic splenomegaly and bilateral axillary LAD (yellow arrows). (E) HE stain of cervical LN biopsy from an EBV-naive patient showing reactive lymphoid hyperplasia with Castleman-like changes (black arrows) and negative EBER ISH staining. (F) Image of biopsy sample from a large mediastinal mass showing lymphoid tissue obliterating normal LN architecture and negative EBER staining. (G) H&E-stained sections of an inguinal LN biopsy from an EBV-positive patient showing reactive lymphoid hyperplasia and positive EBER staining. (H) HE, EBER, CD20, and CD30 staining of cervical LN biopsy tissue from a patient with EBV LPD. (I) Percentage relative to CD3+ DNTs, αβDNTs, and B220+ αβDNTs from age-matched HCs (n = 10), EBV-naive patients (EBV, n = 6), EBV-infected patients (EBV+, n = 10), and ALPS patients (n = 3). Data are expressed as the mean ± SD. *P < 0.05, **P < 0.01, ***P < 0.001, and ****P < 0.0001, by ordinary 1-way ANOVA with Tukey’s multiple comparisons test (α = 0.05). (J) Percentage of T cell death after treatment with different concentrations of the agonistic anti-FAS antibody APO-1.3 or anti-CD3 antibody for HCs, patients with ALPS (ALPS-1 and ALPS-2), and patients with XMEN (A.3, Q.1, and H.1). Results are representative of all XMEN patients tested (n = 13) in 3 independent experiments. (EH) Scale bars: 50 μm (gray), 100 μm (black), and 200 μm (white).
Figure 4
Figure 4. Deep immunophenotyping of PBMCs shows distinctive immune subsets for XMEN compared with HCs and ALPS.
HAL-x on CyTOF data acquired from PBMCs from patients with XMEN (n = 18), patients with ALPS (n = 11), and HCs (n = 24) identified 69 CoD. (A) 2D projection of the identified CoD as visualized by t-distributed stochastic neighbor embedding (t-SNE). (B) Dendrogram showing these CoD based on their abundance of surface epitopes. (C) Dendrogram of the frequencies of these CoD based on unsupervised grouping showing the clustering of patients with XMEN (blue), patients with ALPS (magenta), and HCs (green). (D) ROCs for the random forest classification of XMEN, ALPS, and HCs based on the frequency of their CoD. The AUC value is the mean AUC taken after a 4-fold cross-validation. Each fold of the cross-validation represents a different separation (of the patients) into training and testing sets. 95% CIs are shown (gray).
Figure 5
Figure 5. Selective N-glycosylation defects in XMEN disease.
(A) Model of MAGT1 as a facilitator of STT3B-dependent transference of oligosaccharides (blue and pale pink) to glycosites (red) of nascent peptides (gray) in the ER (13, 15, 16, 19). (B) Flow cytometric histogram and MFI quantification relative to HCs of NKG2D and CD5 in CD8+T cells from HCs (blue) and patients with XMEN (red), with an unstained control (gray, n = 6). (C) Immunoblot of NKG2D, MAGT1, and β-tubulin in T cells from HCs and patients with XMEN, with (+) or without (–) PNGase F treatment. Unglycosylated (0), partially glycosylated (1), and fully glycosylated (3) NKG2D bands and nonspecific (2) and PNGase F (*) bands. (D) Flow cytometric histogram and MFI quantification relative to HCs of NKG2D and CD5 in CD8+ T cells treated for 24 hours with DMSO vehicle (blue) or tunicamycin (red) with unstained control (gray). PE, fluorophore R-phycoerythrin. (E) Immunoblot of NKG2D and β-tubulin in T cells with (+) or without (–) PNGase F treatment after incubation with DMSO (Veh) or 10 μg/mL tunicamycin (Tun) for 18 hours. Fully glycosylated (1) and unglycosylated (0) NKG2D and PNGase F (*) bands. (F) Heatmap depicting significantly different glycopeptides between HCs (n = 3) and patients with XMEN (n = 3), with increased (red) and decreased (black) glycosylation shown. Numbers on the left for immunoblots indicate kDa standards. Data are representative of 6 (C) and 3 (E) replicates, respectively. Data represent the mean ± SEM. ****P < 0.0001, by 1-sample t test with μ = 1 (B and D) and 2-sample t test (F).
Figure 6
Figure 6. Impaired glycosylation of immune proteins and CDT pattern in XMEN disease.
(A) Flow cytometric histogram and MFI quantification relative to HCs of CD28, CD70, HLA-DR, and TCRβ in T cells from HCs (blue) and patients with XMEN (red), with an unstained control (gray, n = 6). (B) Immunoblot of CD70, HLA-DR, TCRβ, CERS2, SLC4A7, and β-tubulin in T cells from HCs and patients with XMEN with (+) or without (–) PNGase F treatment. Unglycosylated (0), partially glycosylated (1), and fully glycosylated (2) bands. (C) Immunoblot of CD28 and HSP90 in T cells from HCs (n = 2) and patients with XMEN (n = 12) with the indicated mutations. Glycosylated (1) and unglycosylated (2) CD28 bands. (D) Immunoblot of CD28 and HSP90 in T cells treated with DMSO (0) or tunicamycin for 48 hours. Glycosylated (1) and unglycosylated (2) CD28 bands. The numbers on the left for immunoblots indicate kDa standards. (E) Pie chart showing the biological function of abnormally glycosylated proteins in XMEN. (F) Mass spectrometric traces of a CDT test for HCs (blue) and patients with XMEN (red). Mass and intensity are expressed in daltons (Da) and counts per second (cps), respectively. Data are representative of 5 (B), 2 (C), and 3 (D) replicates. Data represent the mean ± SEM. *P < 0.05 and **P < 0.01, by 1-sample t test with μ = 1.
Figure 7
Figure 7. Motifs of glycopeptides affected in XMEN disease.
(A) Venn diagram shows the number of differentially glycosylated peptides in XMEN that mapped to regions on a protein that were within the last 55 amino acids of the C-terminus (C-Term), in short loops between 2 TM regions (Loop), in cysteine-rich regions of cysteine-rich proteins (Cys-Rich), in the N-terminus domain of multi-TM proteins (N-Term), and/or within 60 amino acids of TM regions. (B) Bar plot shows the counts of hypoglycosylated (blue) and hyperglycosylated (red) peptides in XMEN that mapped to the above regions.
Figure 8
Figure 8. Rescue of N-glycosylation by MAGT1 mRNA transfection in XMEN T cells.
(A) Flow cytometric histograms of NKG2D, CD70, and CD5 in T cells from a HC (blue line) and a patient with XMEN, 48 hours after transfection of mRNA encoding GFP (red line) or MAGT1 (light blue fill). (B) Immunoblot of NKG2D, CD70, CERS2, TCRβ, SLC4A7, and β-actin in T cells from a HC and a patient with XMEN, 48 hours after GFP or MAGT1 mRNA transfection. Fully glycosylated (2), partially glycosylated (1), and unglycosylated (0) bands are indicated. Data in A and B are representative of 3 independent experiments.

Comment in

  • XMEN: welcome to the glycosphere.
    Freeze HH. Freeze HH. J Clin Invest. 2020 Jan 2;130(1):80-82. doi: 10.1172/JCI134240. J Clin Invest. 2020. PMID: 31815737 Free PMC article.

References

    1. Li FY, et al. Second messenger role for Mg2+ revealed by human T-cell immunodeficiency. Nature. 2011;475(7357):471–476. doi: 10.1038/nature10246. - DOI - PMC - PubMed
    1. Chaigne-Delalande B, et al. Mg2+ regulates cytotoxic functions of NK and CD8 T cells in chronic EBV infection through NKG2D. Science. 2013;341(6142):186–191. doi: 10.1126/science.1240094. - DOI - PMC - PubMed
    1. Li FY, Chaigne-Delalande B, Su H, Uzel G, Matthews H, Lenardo MJ. XMEN disease: a new primary immunodeficiency affecting Mg2+ regulation of immunity against Epstein-Barr virus. Blood. 2014;123(14):2148–2152. doi: 10.1182/blood-2013-11-538686. - DOI - PMC - PubMed
    1. Ravell J, Chaigne-Delalande B, Lenardo M. X-linked immunodeficiency with magnesium defect, Epstein-Barr virus infection, and neoplasia disease: a combined immune deficiency with magnesium defect. Curr Opin Pediatr. 2014;26(6):713–719. doi: 10.1097/MOP.0000000000000156. - DOI - PMC - PubMed
    1. Fisher GH, et al. Dominant interfering Fas gene mutations impair apoptosis in a human autoimmune lymphoproliferative syndrome. Cell. 1995;81(6):935–946. doi: 10.1016/0092-8674(95)90013-6. - DOI - PubMed

Publication types

MeSH terms