. 2020 Apr;20(4):1105-1115.
doi: 10.1111/ajt.15698. Epub 2019 Dec 16.

Hypertension, but not body mass index, is predictive of increased pancreatic lipid content and islet dysfunction

Affiliations

Hypertension, but not body mass index, is predictive of increased pancreatic lipid content and islet dysfunction

Daniel M Tremmel et al. Am J Transplant. 2020 Apr.

Abstract

Pancreatic steatosis is thought to be a negative risk factor for pancreas transplant outcomes. Despite considering donor body mass index (BMI) and the visualization of intercalated fat as indicators of donor pancreas lipid content, transplant surgeons do not use a quantitative method to directly measure steatosis when deciding to transplant a pancreas. In this study, we used nondiabetic human pancreata donated for research to measure the pancreatic and islet-specific lipid content to determine which clinical markers correlate best with lipid content. Interestingly, we found that BMI and age correlate with increased pancreatic lipid content (Panc-LC) in men, but not women. Our findings further suggest that total Panc-LC correlates with an increase in islet lipid content for both men and women. We noted that pancreata donated from individuals with a history of hypertension have increased Panc-LC independent of donor BMI or sex. Moreover, we identify hypertension as a risk factor for reduced islet function after islet isolation. Together, our findings emphasize differences in pancreas graft quality related to pancreatic and islet lipid content, which may not be predicted by assessing BMI alone but may be influenced by a donor history of hypertension.

Keywords: basic (laboratory) research/science; donors and donation; hypertension/antihypertensives; organ procurement; organ procurement and allocation; organ transplantation in general; pancreas/simultaneous pancreas-kidney transplantation; translational research/science.


Conflict of interest statement

Disclosure: JSO declares that he is scientific co-founder, is chair of the Scientific Advisory Board, is Chief Scientific Officer and has equity in Regenerative Medical Solutions, Inc. The remaining authors of this manuscript have no conflicts of interest to disclose.

Figures

Figure 1.
Figure 1.. Pancreas lipid content is correlated with BMI and age for all donors.
A-B) Correlations including BMI, Age, and Panc-LC in all pancreatic donors (men and women combined) indicate a significant correlation for BMI and Panc-LC. The 95% confidence interval is shaded around the line of best fit. The p-values were determined using a Pearson correlation. Donor BMI and Age are extracted from the donor chart in the UNOS system. Error bars indicate ± 1 SD among technical replicates for Panc-LC. N=55 donor pancreata.
Figure 2.
Figure 2.. Pancreas lipid content is correlated with BMI and age in men only.
A-D) Correlations including BMI, Age, and Panc-LC in sex-stratified donor populations as labeled above indicate significant correlations for men. The 95% confidence interval is shaded around the line of best fit. The p-values were determined using a Pearson correlation. Error bars indicate ± 1 SD among technical replicates for Panc-LC. Donor BMI and Age are extracted from the UNOS system. N=29 men; N=26 women donor pancreata.
Figure 3.
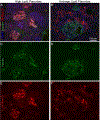
Figure 3.. Islets from steatotic donors (high lipid pancreata) are enriched for lipids within islets.
A-F) Sections from a high lipid pancreas (70.2% Panc-LC) and an average lipid pancreas (26.0% Panc-LC) were embedded in OCT were stained for insulin (green), ORO (red), and DAPI (blue) and imaged at 20X magnification. A) Representative merged image showing ORO-positive tissue overlapping with insulin-positive tissue in a pancreas with high Panc-LC. B) Representative merged image depicting ORO-positive tissue separate from insulin-positive tissue (localized to the acinar) in a pancreas with average Panc-LC. C-D) Insulin channel showing the localization of islets in both pancreata. E-F) ORO channel showing the localization of lipids in both pancreata. Scale bar in B = 100μm.
Figure 4.
Figure 4.. Panc-LC is significantly correlated with Islet-LC and the Isl/Ac lipid ratio.
A-B) Correlations including Panc-LC, Islet-LC, and an Isl/Ac lipid ratio for a subset of donors. Islet-LC tends to appear in high Panc-LC pancreata. The 95% confidence interval is shaded around the line of best fit, and the p-values were determined using a Pearson correlation. Error bars represent ± 1SD. N=35 donors.
Figure 5.
Figure 5.. Donor history of hypertension is predictive of increased pancreas and islet lipid content independent from changes in BMI.
A) Correlation plots for Panc-LC and BMI indicate two distinct populations of donors with differences in Panc-LC independent of BMI. Donors were divided into groups with no history of HTN (N=27) and history of HTN (<5 yr, N=8) (5+ yr, N=14) B) Average BMI and C) Panc-LC for the three groups. D) Average Islet-LC in no HTN (N=15) and HTN (<5 yr, N=8) (5+ yr, N=11) groups. Error bars indicate ± 1SD, (** p<0.01, *** p<0.001, as compared to the no the HTN groups).
Figure 6.
Figure 6.. Donor history of hypertension, but not BMI, is predictive of islet dysfunction.
A) Among all islet donors, there is no significant correlation between islet function (SI) and BMI (N=95). B) Donors with BMI <30 (N=29) and BMI >35 (N=35) have indistinguishable islet function by GSIS. C) Donors were divided into groups with no history of HTN (N=58) and history of HTN (<5 yr, N=20) (5+ yr, N=14). Donors with 5+ years of documented hypertension had significantly lower SI following islet isolation. Error bars indicate ± 1SD, (*p<0.05, as compared to the no HTN group).

References

    1. Roglic G, World Health Organization. Global report on diabetes. Geneva, Switzerland: World Health Organization; 2016.
    1. Collaborators GBDO, Afshin A, Forouzanfar MH, et al. Health Effects of Overweight and Obesity in 195 Countries over 25 Years. N Engl J Med. 2017;377(1):13–27. - PMC - PubMed
    1. Collaborators GBDRF, Forouzanfar MH, Alexander L, et al. Global, regional, and national comparative risk assessment of 79 behavioural, environmental and occupational, and metabolic risks or clusters of risks in 188 countries, 1990–2013: a systematic analysis for the Global Burden of Disease Study 2013. Lancet. 2015;386(10010):2287–2323. - PMC - PubMed
    1. Marin-Penalver JJ, Martin-Timon I, Sevillano-Collantes C, Del Canizo-Gomez FJ. Update on the treatment of type 2 diabetes mellitus. World J Diabetes. 2016;7(17):354–395. - PMC - PubMed
    1. Gruessner RW, Sutherland DE, Gruessner AC. Mortality assessment for pancreas transplants. Am J Transplant. 2004;4(12):2018–2026. - PubMed

Publication types