. 2019 Nov 8;20(22):5574.
doi: 10.3390/ijms20225574.

Establishing Computational Approaches Towards Identifying Malarial Allosteric Modulators: A Case Study of Plasmodium falciparum Hsp70s

Affiliations

Establishing Computational Approaches Towards Identifying Malarial Allosteric Modulators: A Case Study of Plasmodium falciparum Hsp70s

Arnold Amusengeri et al. Int J Mol Sci. .

Abstract

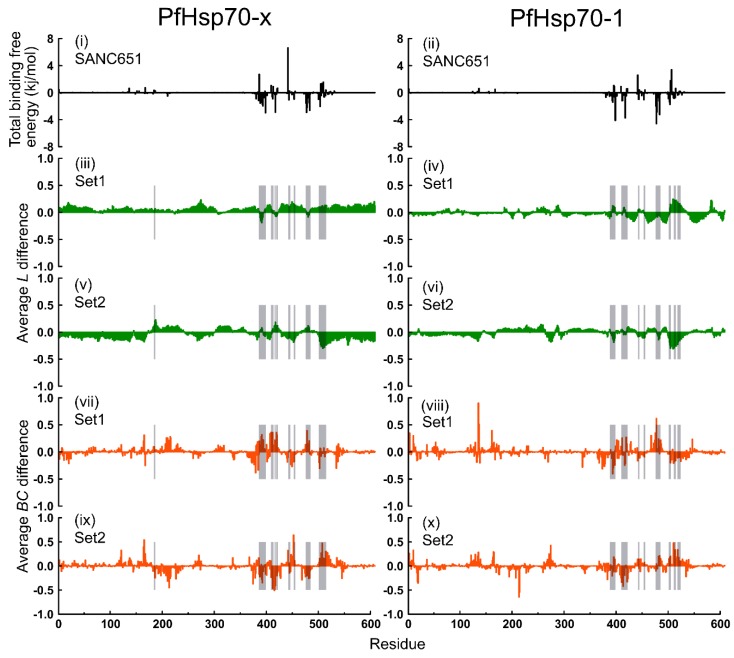
Combating malaria is almost a never-ending battle, as Plasmodium parasites develop resistance to the drugs used against them, as observed recently in artemisinin-based combination therapies. The main concern now is if the resistant parasite strains spread from Southeast Asia to Africa, the continent hosting most malaria cases. To prevent catastrophic results, we need to find non-conventional approaches. Allosteric drug targeting sites and modulators might be a new hope for malarial treatments. Heat shock proteins (HSPs) are potential malarial drug targets and have complex allosteric control mechanisms. Yet, studies on designing allosteric modulators against them are limited. Here, we identified allosteric modulators (SANC190 and SANC651) against P. falciparum Hsp70-1 and Hsp70-x, affecting the conformational dynamics of the proteins, delicately balanced by the endogenous ligands. Previously, we established a pipeline to identify allosteric sites and modulators. This study also further investigated alternative approaches to speed up the process by comparing all atom molecular dynamics simulations and dynamic residue network analysis with the coarse-grained (CG) versions of the calculations. Betweenness centrality (BC) profiles for PfHsp70-1 and PfHsp70-x derived from CG simulations not only revealed similar trends but also pointed to the same functional regions and specific residues corresponding to BC profile peaks.

Keywords: South African natural compounds; allosteric drugs; betweenness centrality; dynamic residue networks; heat shock proteins.


Conflict of interest statement

The authors declare that the research was conducted in the absence of any commercial or financial relationship that could be construed as a potential conflict of interest. The funders had no role in the design of the study; in the collection, analyses, or interpretation of data; in the writing of the manuscript, or in the decision to publish the results.

Figures

Figure 1
Figure 1
Maximum likelihood phylogenetic tree based on Hsp70 sequences showing the relationship between host (Hsc70) and parasitic proteins (PfHsp70-x and PfHsp70-1). Color code: Red: PfHsp70-x, PfHsp70-1, and Hsc70; purple: 7 non-falciparum (plasmodial); grey: 19 Protozoan (non-plasmodial); blue: 19 Eukaryotic (non-protozoan); yellow: 2KHO and 4B9Q. Percentage recurrence of 1000 bootstrap tests is indicated next to the branches.
Figure 2
Figure 2
Chemical structures of identified natural compounds docked to the β-SBD back pocket in both PfHsp70-x and PfHsp70-1.
Figure 3
Figure 3
(AL) Violin plots showing the kernel probability density distribution of protein backbone RMSDs per MD run. Density traces were plotted symmetrically to the left and right of boxplots. The width is proportional to frequency of occurrence. The overlaid boxplots highlight data range and the distribution spread. The vertical inside line represents the median value. The bars range from 25th (bottom) to 75th (top) percentile. µ denotes the calculated RMSD mean value.
Figure 4
Figure 4
Histograms of protein backbone RMSDs against the frequency of occurrence. The distribution in conformation populations between ligand-free and ligand-bound trajectories over 100 ns were compared. Dotted lines represent positions of calculated means. Color key: Yellow: ligand-free; red: SANC190-bound; blue: SANC651-bound. Histograms of duplicate trajectories can be found in supplementary data (Figure S4).
Figure 5
Figure 5
Kernel density estimation plots of the radius gyration (Rg). Comparisons of structural compactness between ligand-free and ligand-bound PfHsp70-x and PfHsp70-1. (AL) The RMSD violin plotting scheme was employed in plotting the Rg figure as well.
Figure 6
Figure 6
Gibbs free energy landscapes illustrating conformation equilibrium observables as a function of PC1 and PC2. Colors range from yellow (Gibbs free energy minima) to purple (Gibbs free energy maxima). Each contour ring represents a change in the Gibbs free energy by 1 kJ/mol. Conformations visited (conformers) during simulations were labeled from C1–C30.
Figure 7
Figure 7
Representative ligand-free and ligand-bound sub states (colored grey) of PfHsp70-x and PfHsp70-1. Structures were obtained from conformation clusters occupying low energy basins as depicted in Figure 6. The middle panel displays porcupine plots illustrating the direction and magnitude (indicated by the length of the porcupine) of dominant protein motions observed during simulation. Color code: Green: PfHsp70-x, Blue: PfHsp70-1. Circular arrows indicate ~90° rotation of structures.
Figure 8
Figure 8
Per residue average L and average BC difference calculated between ligand-free and SANC190-bound systems (run1 and run2 on average). Top panel: Residues governing protein-ligand affinity; middle panel: Per residue average L difference; bottom panel: Per residue average BC difference.
Figure 9
Figure 9
Computed average L and average BC per residue difference between ligand-free and SANC651-bound models (run1 and run2 on average). Top panel: Residues governing protein-ligand affinity; middle panel: Per residue average L difference; bottom panel: Per residue average BC difference.

References

    1. Organization W.H. World Malaria Report 2018. World Health Organization; Geneva, Switzerland: 2018.
    1. Witkowski B., Lelièvre J., Barragán M.J.L., Laurent V., Su X., Berry A., Benoit-Vical F. Increased tolerance to artemisinin in Plasmodium falciparum is mediated by a quiescence mechanism. Antimicrob. Agents Chemother. 2010;54:1872–1877. doi: 10.1128/AAC.01636-09. - DOI - PMC - PubMed
    1. Musyoka T.M., Kanzi A.M., Lobb K.A., Tastan Bishop Ö. Structure Based Docking and Molecular Dynamic Studies of Plasmodial Cysteine Proteases against a South African Natural Compound and its Analogs. Sci. Rep. 2016;6:23690. doi: 10.1038/srep23690. - DOI - PMC - PubMed
    1. Musyoka T.M., Kanzi A.M., Lobb K.A., Tastan Bishop Ö. Analysis of non-peptidic compounds as potential malarial inhibitors against Plasmodial cysteine proteases via integrated virtual screening workflow. J. Biomol. Struct. Dyn. 2016;34:2084–2101. doi: 10.1080/07391102.2015.1108231. - DOI - PMC - PubMed
    1. Mugumbate G., Newton A.S., Rosenthal P.J., Gut J., Moreira R., Chibale K., Guedes R.C. Novel anti-Plasmodial hits identified by virtual screening of the ZINC database. J. Comput. Aided. Mol. Des. 2013 doi: 10.1007/s10822-013-9685-z. - DOI - PubMed

MeSH terms