Spatiotemporal Distribution of Tuberculosis during Urbanization in the New Urban Area of Nanchang City, China, 2010-2018
- PMID: 31717896
- PMCID: PMC6888413
- DOI: 10.3390/ijerph16224395
Spatiotemporal Distribution of Tuberculosis during Urbanization in the New Urban Area of Nanchang City, China, 2010-2018
Abstract
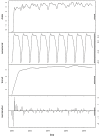
Background: Urbanization will play a key role in ending the tuberculosis (TB) epidemic by 2030, but understanding the relationship between urbanization and the health threats posed by TB is incomplete. Therefore, this study aimed to explore the spatiotemporal distribution of TB at the township level during urbanization in the new urban area of Nanchang.
Methods: Seasonal-trend decomposition of time series analysis was used to explore the seasonal distribution and trend analysis. Global and local spatial autocorrelation statistics, and space-time scan statistics were performed to detect the spatiotemporal clusters of TB cases in the new urban area of Nanchang from 2010 to 2018.
Results: A total of 3245 TB cases were reported in the study area from 2010 to 2018. Of all the TB cases, 68% occurred in individuals older than 40 years old, 73.2% were male cases, and 56.6% were farmers. The primary seasonal peak was in late spring (April), and a smaller peak was in early autumn (September). The results of local indicators of spatial association showed that Jiaoqiao town and Changleng town might be "High-High" clusters. The most likely spatiotemporal cluster was located in the southwest of the study area in 2010, which included five towns, and then shifted to the northeast gradually. Across 2010 to 2018, nine spatiotemporal clusters were identified. The most likely cluster was located at the northeast of the study area. The center of this area was in Nanji town with a circle radius of 43.74 kilometers.
Conclusions: The spatial clusters of TB incidence shifted to the rural region and the fringe of the new urban area of Nanchang. Targeted management strategies for urban migrants in the process of urbanization should be strengthened.
Keywords: spatiotemporal distribution; tuberculosis; urbanization.
Conflict of interest statement
The authors declare that there are no conflicts of interest.
Figures


References
-
- Tuite A.R., Guthrie J.L., Alexander D.C., Whelan M.S., Lee B., Lam K., Ma J., Fisman D.N., Jamieson F.B. Epidemiological evaluation of spatiotemporal and genotypic clustering of Mycobacterium tuberculosis in Ontario, Canada. Int. J. Tuberc. Lung Dis. 2013;17:1322–1327. doi: 10.5588/ijtld.13.0145. - DOI - PubMed
-
- Chinese Ministry of Health; [(accessed on 11 September 2019)]. The National Overview of Notifiable Infectious Disease in 2018. Available online: http://www.nhc.gov.cn/jkj/s3578/201904/050427ff32704a5db64f4ae1f6d57c6c.....
-
- Shi Q.N., Ma J.Q. Big data analysis of tuberculosis dynamic surveillance in China. Chin. J. Health Inf. Manag. 2017;14:643–648.
MeSH terms
LinkOut - more resources
Full Text Sources
Medical
Miscellaneous

