. 2019 Nov 11;8(11):492.
doi: 10.3390/plants8110492.

Asparagine Synthesis During Tobacco Leaf Curing

Affiliations

Asparagine Synthesis During Tobacco Leaf Curing

Lucien Bovet et al. Plants (Basel). .

Abstract

Senescence is a genetically controlled mechanism that modifies leaf chemistry. This involves significant changes in the accumulation of carbon- and nitrogen-containing compounds, including asparagine through the activity of asparagine synthetases. These enzymes are required for nitrogen re-assimilation and remobilization in plants; however, their mechanisms are not fully understood. Here, we report how leaf curing-a senescence-induced process that allows tobacco leaves to dry out-modifies the asparagine metabolism. We show that leaf curing strongly alters the concentration of the four main amino acids, asparagine, glutamine, aspartate, and glutamate. We demonstrate that detached tobacco leaf or stalk curing has a different impact on the expression of asparagine synthetase genes and accumulation of asparagine. Additionally, we characterize the main asparagine synthetases involved in the production of asparagine during curing. The expression of ASN1 and ASN5 genes is upregulated during curing. The ASN1-RNAi and ASN5-RNAi tobacco plant lines display significant alterations in the accumulation of asparagine, glutamine, and aspartate relative to wild-type plants. These results support the idea that ASN1 and ASN5 are key regulators of asparagine metabolism during leaf curing.

Keywords: asparagine; asparagine synthetases; curing; nitrogen assimilation; senescence; tobacco.


Conflict of interest statement

The work subject of the publication was entirely funded by PMI and all authors are employees of Philip Morris International.

Figures

Figure 1
Figure 1
(a) Chart of total and free amino acid distribution in mature leaves of burley tobacco at harvest and after air curing. Each sector represents the frequency distribution (mg/g dry weight [DW]) of amino acids in the total amino acid fraction, and after hydrolysis (free amino acids) when the leaf tissue is harvested and air cured (45 days post-harvest). Data were collected from three biological replicates (n = 3). (b) Time course of the air curing effect on the accumulation of asparagine and glutamine (left panel) and aspartate and glutamic acid (right panel) in tobacco burley leaves. The free amino acids were quantified at different time points during air curing. Data were collected from three biological replicates (n = 3). Each data point represents the mean free amino acid content (in mg/g of dry weight [DW]). Vertical bars are standard deviation (SD).
Figure 2
Figure 2
Molecular phylogenetic tree of plant asparagine synthetases (ASN). The ASN genes of Nicotiana tabacum originate from ancestors of Nicotiana sylvestris (S) or Nicotiana tomentosiformis (T). Tobacco polypeptides ASN1-S, ASN1-T, ASN3-S, ASN3-T, ASN5-S, and ASN5-T were compared with Arabidopsis proteins AtASN1 (At3g47340), AtASN2 (At5g65010), and AtASN3 (At5g10240) and tomato proteins Solyc06g007180 and Solyc04g055200. The tree was constructed by using the PHYLIP software, and the numbers are bootstrap values. The scale indicates the distance between two sequences, based on the distance matrix from MUSCLE alignment.
Figure 3
Figure 3
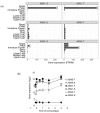
(a) Expression of asparagine synthetase (ASN) genes in different organs of burley tobacco. Tissue samples, including the sepal, petal, immature flower stem, root, and leaf in lower, middle, and upper positions, were collected from burley TN90 tobacco plants at flowering stage when lower leaves just started to senesce and became ready for curing, and were then used for RNA-seq analysis. Each bar represents the averaged FPKM (Fragments Per Kilobase of exon per Million fragments mapped) values corresponding the relative expression levels of the gene. Data were collected from three biological replicates and analyzed by p values adjusted for false discovery rate. Asterisks indicate statistical significance when comparing expression levels among tissues (n = 3, *** p < 0.001). (b) Time course of the air curing effect on the asparagine synthetase (ASN) gene expression in burley tobacco leaves. The expression patterns of ASN genes (ASN1-S, ASN1-T, ASN3-S, ASN3-T, ASN5-S, and ASN5-T) were followed at early stages of air curing (1 to 4 days post-harvest). Data were collected from three biological replicates. Each datapoint represents the mean of gene expression (in log2) estimated by using the Affymetrix Tobacco exon array in accordance with Martin et al. [39]. Vertical bars are standard deviation (SD).
Figure 4
Figure 4
(a) Asparagine (Asn) content in air cured lower, middle, and upper leaves of two burley varieties (TN90 and CH-Burley). Leaf curing was performed either individually on string (Detached leaf) or on the stalk (Attached leaf) for 50 days. Data were collected from three biological replicates. The data are summarized in histogram bars, in which each bar represents the mean Asn content and the error bar represents the standard deviation (SD). Asterisks indicate statistical significance when comparing detached and attached leaf-curing conditions (n = 3; *** p value < 0.001; t-test). (b) ASN gene expression in the middle leaf position during the first 96 h of air curing either on string (Detached leaf curing; upper panel) or on stalk (Attached leaf curing; lower panel). Leaf samples from burley TN90 plants were collected during curing and used for RNA-seq analysis. Each data point is calculated from the averaged FPKM (Fragments Per Kilobase of exon per Million Fragments Mapped) values and represents the relative expression level of the gene. Data were collected from three biological replicates. Vertical bars are SD. Asterisks indicate statistical significance when comparing the expression levels at the start and after 4 days of curing (n = 3; *** p < 0.001; t-test).
Figure 4
Figure 4
(a) Asparagine (Asn) content in air cured lower, middle, and upper leaves of two burley varieties (TN90 and CH-Burley). Leaf curing was performed either individually on string (Detached leaf) or on the stalk (Attached leaf) for 50 days. Data were collected from three biological replicates. The data are summarized in histogram bars, in which each bar represents the mean Asn content and the error bar represents the standard deviation (SD). Asterisks indicate statistical significance when comparing detached and attached leaf-curing conditions (n = 3; *** p value < 0.001; t-test). (b) ASN gene expression in the middle leaf position during the first 96 h of air curing either on string (Detached leaf curing; upper panel) or on stalk (Attached leaf curing; lower panel). Leaf samples from burley TN90 plants were collected during curing and used for RNA-seq analysis. Each data point is calculated from the averaged FPKM (Fragments Per Kilobase of exon per Million Fragments Mapped) values and represents the relative expression level of the gene. Data were collected from three biological replicates. Vertical bars are SD. Asterisks indicate statistical significance when comparing the expression levels at the start and after 4 days of curing (n = 3; *** p < 0.001; t-test).
Figure 5
Figure 5
Asn, Gln, Asp, and Glu abundance during the curing time course in detached and attached leaves. Arbitrary units are used for quantification of each metabolite. Quantification data of Asn, Gln, Asp, and Glu are presented at harvest, after 48, 96, and 192 h of curing, and at the end of curing (Cured). Datapoints are the mean of three biological replicates (n = 3). Vertical bars are standard deviation (SD).
Figure 6
Figure 6
Asparagine, glutamine, and aspartate content in middle leaf lamina of wild-type, ASN1-RNAi, and ASN5-RNAi tobacco plants at the end of detached leaf curing. (a) Asparagine (Asn), (b) Glutamine (Gln), and (c) Aspartic acid (Asp) levels were measured in bulk leaves from 15 T1 transformed burley plants. Data were determined from experiments on three independent transformation events. The data are summarized in histogram bars, in which each bar signifies the amino acid content in mg/g dry weight, and the error bar represents the standard deviation (SD).

References

    1. Good A.G., Shrawat A.K., Muench D.G. Can less yield more? Is reducing nutrient input into the environment compatible with maintaining crop production? Trends Plant Sci. 2004;9:597–605. doi: 10.1016/j.tplants.2004.10.008. - DOI - PubMed
    1. Tegeder M., Masclaux-Daubresse C. Source and sink mechanisms of nitrogen transport and use. New Phytol. 2018;217:35–53. doi: 10.1111/nph.14876. - DOI - PubMed
    1. Staswick P.E. Novel Regulation of Vegetative Storage Protein Genes. Plant Cell. 1990;2:1–6. doi: 10.2307/3869045. - DOI - PMC - PubMed
    1. Lothier J., Gaufichon L., Sormani R., Lemaître T., Azzopardi M., Morin H., Chardon F., Reisdorf-Cren M., Avice J.-C., Masclaux-Daubresse C. The cytosolic glutamine synthetase GLN1;2 plays a role in the control of plant growth and ammonium homeostasis in Arabidopsis rosettes when nitrate supply is not limiting. J. Exp. Bot. 2011;62:1375–1390. doi: 10.1093/jxb/erq299. - DOI - PubMed
    1. Tegeder M. Transporters involved in source to sink partitioning of amino acids and ureides: Opportunities for crop improvement. J. Exp. Bot. 2014;65:1865–1878. doi: 10.1093/jxb/eru012. - DOI - PubMed

LinkOut - more resources