. 2019 Nov 19;8(22):e012792.
doi: 10.1161/JAHA.119.012792. Epub 2019 Nov 13.

Cardiomyocyte-Specific Snrk Prevents Inflammation in the Heart

Affiliations

Cardiomyocyte-Specific Snrk Prevents Inflammation in the Heart

Karthikeyan Thirugnanam et al. J Am Heart Assoc. .

Abstract

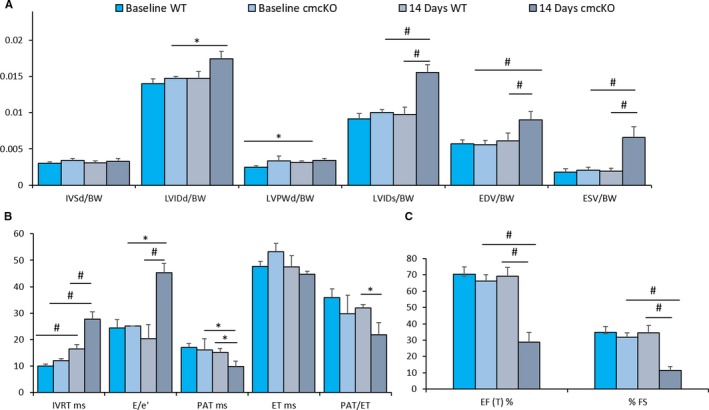
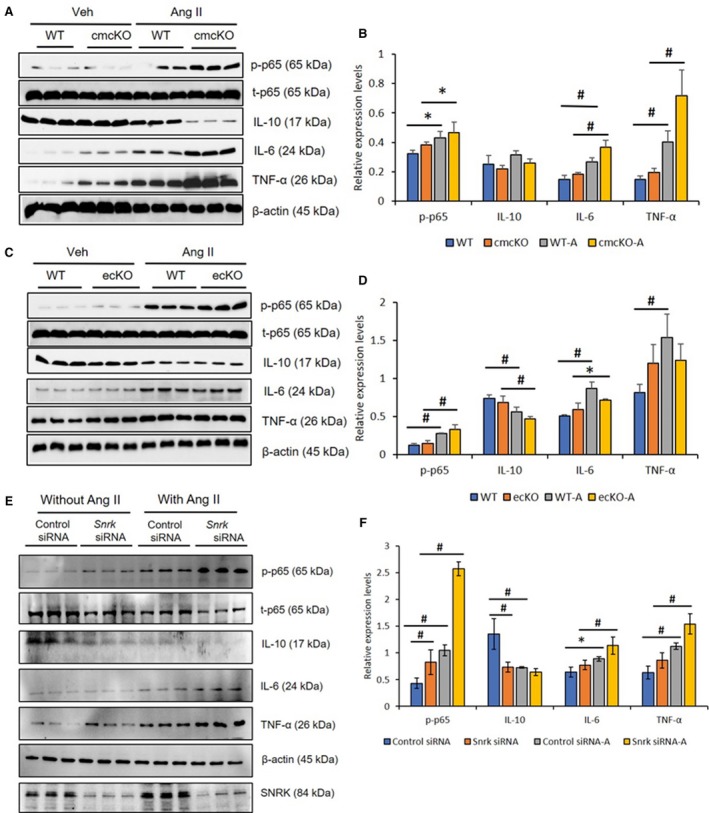
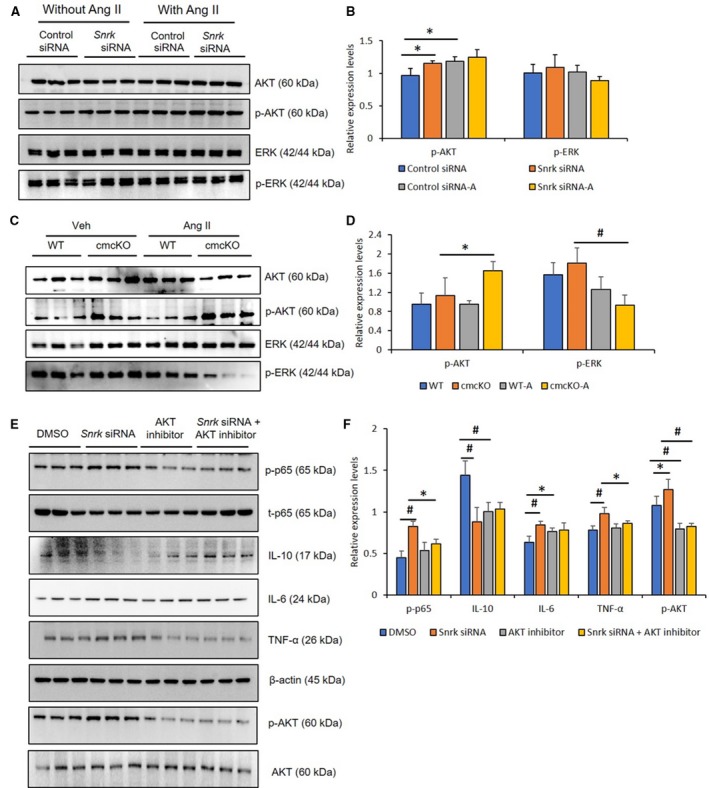
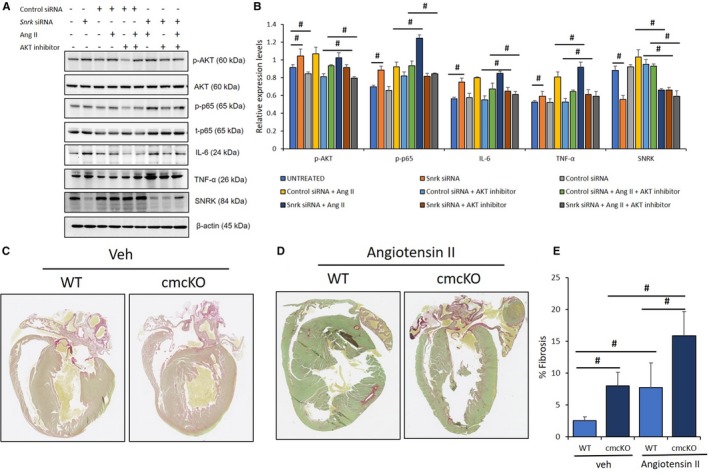
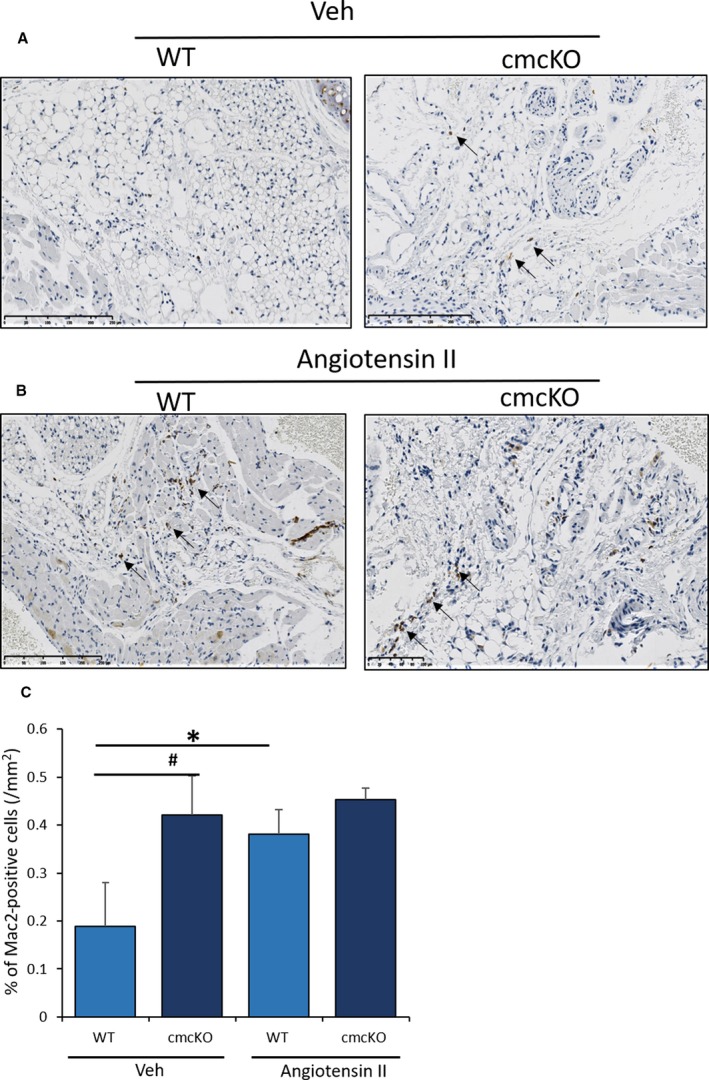
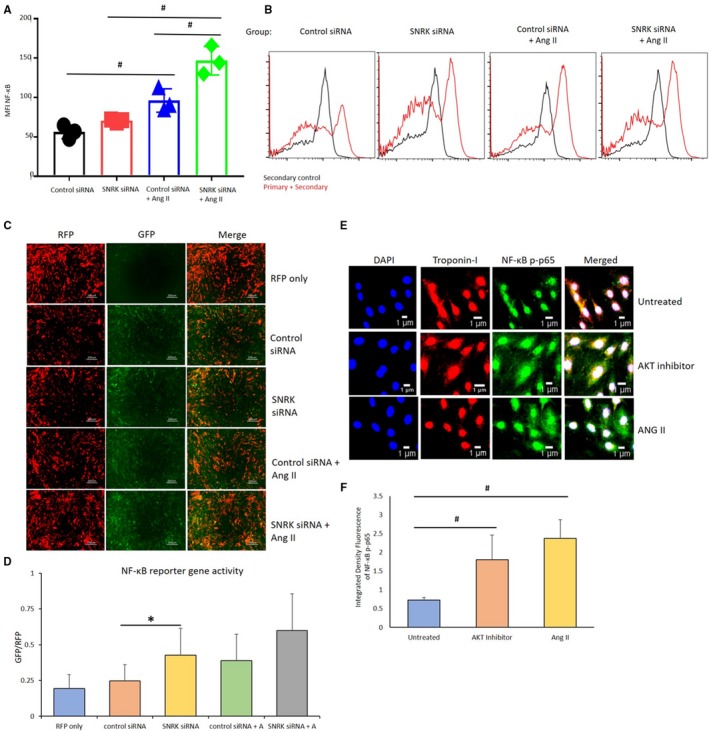
Background The SNRK (sucrose-nonfermenting-related kinase) enzyme is critical for cardiac function. However, the underlying cause for heart failure observed in Snrk cardiac conditional knockout mouse is unknown. Methods and Results Previously, 6-month adult mice knocked out for Snrk in cardiomyocytes (CMs) displayed left ventricular dysfunction. Here, 4-month adult mice, on angiotensin II (Ang II) infusion, show rapid decline in cardiac systolic function, which leads to heart failure and death in 2 weeks. These mice showed increased expression of nuclear factor κ light chain enhancer of activated B cells (NF-κB), inflammatory signaling proteins, proinflammatory proteins in the heart, and fibrosis. Interestingly, under Ang II infusion, mice knocked out for Snrk in endothelial cells did not show significant systolic or diastolic dysfunction. Although an NF-κB inflammation signaling pathway was increased in Snrk knockout endothelial cells, this did not lead to fibrosis or mortality. In hearts of adult mice knocked out for Snrk in CMs, we also observed NF-κB pathway activation in CMs, and an increased presence of Mac2+ macrophages was observed in basal and Ang II-infused states. In vitro analysis of Snrk knockdown HL-1 CMs revealed similar upregulation of the NF-κB signaling proteins and proinflammatory proteins that was exacerbated on Ang II treatment. The Ang II-induced NF-κB pathway-mediated proinflammatory effects were mediated in part through protein kinase B or AKT, wherein AKT inhibition restored the proinflammatory signaling protein levels to baseline in Snrk knockdown HL-1 CMs. Conclusions During heart failure, SNRK acts as a cardiomyocyte-specific repressor of cardiac inflammation and fibrosis.

Keywords: NF‐kB; cardiac hypertrophy; cardiomyocyte; endothelial cell; fibrosis; heart failure; inflammation.


Figures

Figure 1
Figure 1
Angiotensin II (Ang II) induces cardiac failure in 2 weeks in Snrk cmcKO mice. A through C, Echocardiogram results for baseline 4‐month‐old Snrk wild‐type (WT) mice and cardiac‐specific knockout (Snrk cmcKO) mice with Ang II infused for 14 days into Snrk WT mice and 14 days into cardiac‐specific knockout (Snrk cmcKO) mice as described before.15 All data were normalized to body weight (BW) and presented as such. The parameters analyzed are interventricular septum thickness at end‐diastole (IVSd/BW), left ventricular internal dimension at end‐diastole (LVIDd/BW), left ventricular posterior wall thickness at end‐diastole (LVPWd/BW), left ventricular internal dimension at end‐systole (LVIDs/BW), end‐diastole volume (EDV/BW), end‐systolic volume (ESV/BW), isovolumic relaxation time (IVRT), peak velocity of early diastolic transmitral flow (E), early diastolic mitral annular velocity (e′), pulmonary acceleration rate (PAT), ejection time (ET), ejection fraction (EF), fractional shortening (FS). Results are presented as mean±SEM (*P<0.05, # P<0.01). The statistical comparison for P value was done by comparing Snrk WT vs Snrk cmcKO, Snrk WT vs Snrk WT‐Ang II, Snrk cmcKO vs Snrk cmcKO‐Ang II, and Snrk WT‐Ang II vs Snrk cmcKO‐Ang II (n=6 for the WT group and n=3 for Snrk cmcKO and the Ang II–induced experimental group).
Figure 2
Figure 2
Angiotensin II (Ang II)–infused hearts from Snrk conditional knockout mice and Snrk knockdown cardiomyocytes (CMs) show higher levels of proinflammatory response. A and B, Hearts from Snrk cmcKO and (C and D) Snrk ecKO mice were assessed for pro‐ and anti‐inflammatory signaling by immunoblotting. Both knockout mouse groups were analyzed under vehicle‐treated and Ang II–induced conditions similar to wild‐type (WT) control mice. NF‐κB p‐p65, IL‐6, and TNF‐α were assessed for proinflammatory signaling, and IL‐10 was assessed for anti‐inflammatory signaling. Results are presented as mean±SEM (*P<0.05 and # P<0.01). The statistical comparison for P value was done by comparing Snrk WT vs Snrk cmcKO, Snrk WT vs Snrk WT‐Ang II, Snrk cmcKO vs Snrk cmcKO‐Ang II and Snrk WT‐Ang II vs Snrk cmcKO‐Ang II (n=3 animals in each experimental group). E and F, HL‐1 cardiomyocyte cells were treated with Snrk small interfering (si) RNA with and without Ang II and assessed for pro‐ and anti‐inflammatory signaling. Results are presented as mean±SEM (*P<0.05 and # P<0.01). The statistical comparison for P value was done by comparing control siRNA vs Snrk siRNA, control si RNA vs control siRNA‐Ang II, Snrk siRNA vs Snrk siRNA‐Ang II, and control siRNA‐Ang II vs Snrk siRNA‐Ang II (n=3 in each experimental group). cmcKO indicates cardiomyocyte knockout; ecKO, endothelial cell knockout; SEM, standard error of the mean.
Figure 3
Figure 3
Angiotensin II (Ang II)–infused hearts from Snrk cmcKO and Snrk knockdown cardiomyocytes (CMs) show changes in pAKT and pERK signaling pathways. A and B, Immunoblotting analysis of HL‐1 cardiomyocytes were treated with Snrk small interfering (si) RNA with and without Ang II (1 μmol/L) for 24 hours. Results are presented as mean±SEM (*P<0.05). Statistical comparison for P value was done by comparing control siRNA vs Snrk siRNA, control siRNA vs control siRNA‐Ang II, Snrk siRNA vs Snrk siRNA‐Ang II, and control siRNA‐Ang II vs Snrk siRNA‐Ang II (n=3 in each experimental group). C and D, Snrk cmcKO mouse hearts were assessed for phosphorylated forms of AKT and ERK signaling by immunoblotting, KO mouse hearts were analyzed under vehicle‐treated and Ang II–induced conditions, wild‐type (WT) mice were used as controls for both conditions. Results are presented as mean±SEM (*P<0.05 and # P<0.01). The statistical comparison for P value was done by comparing Snrk WT vs Snrk cmcKO, Snrk WT vs Snrk WT‐Ang II, Snrk cmcKO vs Snrk cmcKO‐Ang II, and Snrk WT‐Ang II vs Snrk cmcKO‐Ang II (n=3 animals in each experimental group). E and F, Briefly, HL‐1 cardiomyocyte cells were subjected to Snrk siRNA transfection and treated with and without AKT inhibitor LY294002 (10 μmol/L) for 24 hours and assessed for phosphorylated AKT and the proinflammatory NF‐κB p‐p65, IL‐6, and TNF‐α and anti‐inflammatory IL‐10 signaling. DMSO‐treated cells served as control. Results are presented as mean±SEM (*P<0.05 and # P<0.01 compared with respective treatment groups; n=3 in each experimental group). cmcKO indicates cardiomyocyte knockout; SEM, standard error of the mean.
Figure 4
Figure 4
AKT inhibition under angiotensin II (Ang II)–stimulated conditions in cardiomyocytes (CMs) attenuate inflammation. A, HL‐1 CMs were transfected with control and Snrk small interfering (si) RNA, studied with and without Ang II (1 μmol/L) and/or AKT inhibitor LY294002 (10 μmol/L), and assessed for phosphorylated‐AKT (p‐AKT) and proinflammatory markers NF‐κB p‐p65, IL‐6, and TNF‐α. Untreated cells served as control. Results are presented as mean±SEM (*P<0.05 and # P<0.01 vs respective control siRNA‐treated cells; n=3 in each experimental group). B, Quantification of blots from sample in A. C through E, Snrk cmcKO hearts were analyzed for fibrosis using Sirius red staining, which showed an exacerbated fibrotic environment determined by increased accumulation of collagen in the hearts. The mice were treated with vehicle control (C) and Ang II (D). Significant increases in the accumulation of collagen in the Snrk cmcKO mice were observed compared with wild type (WT); on stimulation with Ang II the collagen deposition increases further. Results are presented as mean±SEM (# P<0.01). The statistical comparison for P value was done by comparing Snrk WT vs Snrk cmcKO, Snrk WT vs Snrk WT–Ang II, Snrk cmcKO vs Snrk cmcKO–Ang II, and Snrk WT–Ang II vs Snrk cmcKO–Ang II (n=3 animals in each experimental group). cmcKO indicates cardiomyocyte knockout; SEM, standard error of the mean; veh, vehicle.
Figure 5
Figure 5
SNRK enhances angiotensin II (Ang II)–induced inflammation in Snrk cmcKO hearts. A, Wild‐type (WT) and Snrk cardiac knockout mice (cmcKO) were treated with vehicle control and Ang II (B). Increased infiltration of macrophages in the Snrk cmcKO mice was observed compared with WT on stimulation with Ang II, and macrophage numbers further increased. Scale bars are 250 μm for Snrk WT, Snrk cmcKO, and Snrk WT‐Ang II and 100 μm for Snrk cmcKO‐Ang II. C, Results are presented as mean±SEM (*P<0.05 and # P<0.01). The statistical comparison for P value was done by comparing Snrk WT vs Snrk cmcKO, Snrk WT vs Snrk WT–Ang II, Snrk cmcKO vs Snrk cmcKO–Ang II, and Snrk WT–Ang II vs Snrk cmcKO–Ang II (n=3 animals in each experimental group). SEM indicates standard error of the mean; veh, vehicle.
Figure 6
Figure 6
NF‐κB transcription and expression in HL‐1 cardiomyocytes. A and B, Flow cytometry analysis for detection of HL‐1 cells positive for the expression of NF‐κB p‐p65. Results are presented as mean±SEM (# P<0.01). The statistical comparison for P value was done by comparing control small interfering (si) RNA vs Snrk siRNA, control siRNA vs Control siRNA–angiotensin II (Ang II), Snrk siRNA vs Snrk siRNA–Ang II, and control siRNA–Ang II vs Snrk siRNA–Ang II (n=3 per each experimental group). C and D, Reporter vector gene assay for the analysis of transcriptional activation of NF‐κB. NF‐κB vector was tagged with GFP protein, RFP acted as positive control for the assessment of infection efficiency. Scale bars are at 200 μm. Results are presented as mean±SEM (*P<0.05). The statistical comparison for P value was done by comparing control siRNA vs Snrk siRNA, control siRNA vs control siRNA–Ang II, Snrk siRNA vs Snrk siRNA–Ang II, and control siRNA–Ang II vs Snrk siRNA–Ang II (n=12 in each experimental group). E and F, HL‐1 cells were treated with AKT inhibitor/Ang II, where Ang II–treated HL‐1 cells show more NF‐κB p‐p65. The resulting colocalizations were quantified using ImageJ software and represented as graphs. Scale bars are at 1 μm. Results are presented as mean±SEM (# P<0.01 vs untreated control cells; n=3 in each experimental group). GFP indicates green fluorescent protein; MFI, Mean Fluorescence Intensity; RFP, red fluorescent protein; SEM, standard error of the mean.

References

    1. Bui AL, Horwich TB, Fonarow GC. Epidemiology and risk profile of heart failure. Nat Rev Cardiol. 2011;8:30–41. - PMC - PubMed
    1. Giamouzis G, Kalogeropoulos A, Georgiopoulou V, Laskar S, Smith AL, Dunbar S, Triposkiadis F, Butler J. Hospitalization epidemic in patients with heart failure: risk factors, risk prediction, knowledge gaps, and future directions. J Card Fail. 2011;17:54–75. - PubMed
    1. Ponikowski P, Anker SD, AlHabib KF, Cowie MR, Force TL, Hu S, Jaarsma T, Krum H, Rastogi V, Rohde LE, Samal UC, Shimokawa H, Budi Siswanto B, Sliwa K, Filippatos G. Heart failure: preventing disease and death worldwide. ESC Heart Fail. 2014;1:4–25. - PubMed
    1. Dick SA, Epelman S. Chronic heart failure and inflammation: what do we really know? Circ Res. 2016;119:159–176. - PubMed
    1. Suthahar N, Meijers WC, Sillje HHW, de Boer RA. From inflammation to fibrosis—molecular and cellular mechanisms of myocardial tissue remodelling and perspectives on differential treatment opportunities. Curr Heart Fail Rep. 2017;14:235–250. - PMC - PubMed

Publication types

MeSH terms