. 2019 Nov 12;19(1):1509.
doi: 10.1186/s12889-019-7681-5.

Optimal allocation of HIV resources among geographical regions

Affiliations

Optimal allocation of HIV resources among geographical regions

David J Kedziora et al. BMC Public Health. .

Abstract

Background: Health resources are limited, which means spending should be focused on the people, places and programs that matter most. Choosing the mix of programs to maximize a health outcome is termed allocative efficiency. Here, we extend the methodology of allocative efficiency to answer the question of how resources should be distributed among different geographic regions.

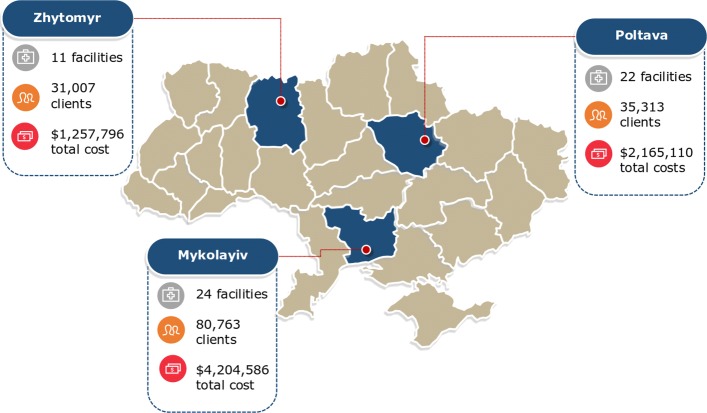
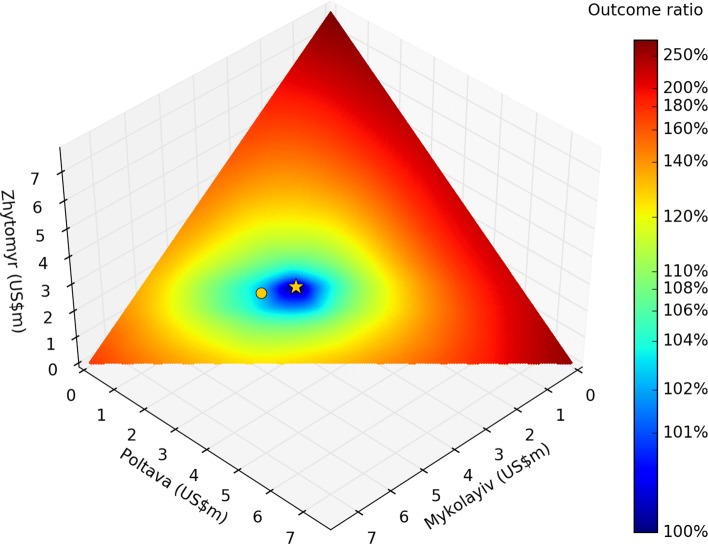
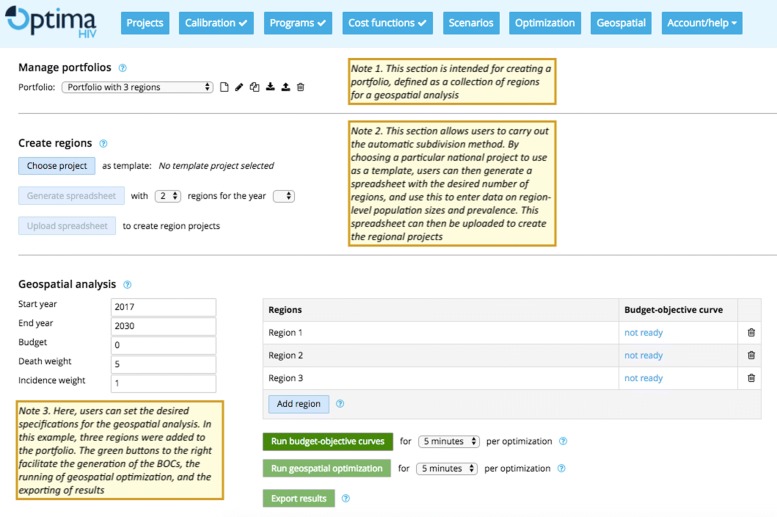
Methods: We describe a novel geographical optimization algorithm, which has been implemented as an extension to the Optima HIV model. This algorithm identifies an optimal funding of services and programs across regions, such as multiple countries or multiple districts within a country. The algorithm consists of three steps: (1) calibrating the model to each region, (2) determining the optimal allocation for each region across a range of different budget levels, and (3) finding the budget level in each region that minimizes the outcome (such as reducing new HIV infections and/or HIV-related deaths), subject to the constraint of fixed total budget across all regions. As a case study, we applied this method to determine an illustrative allocation of HIV program funding across three representative oblasts (regions) in Ukraine (Mykolayiv, Poltava, and Zhytomyr) to minimize the number of new HIV infections.

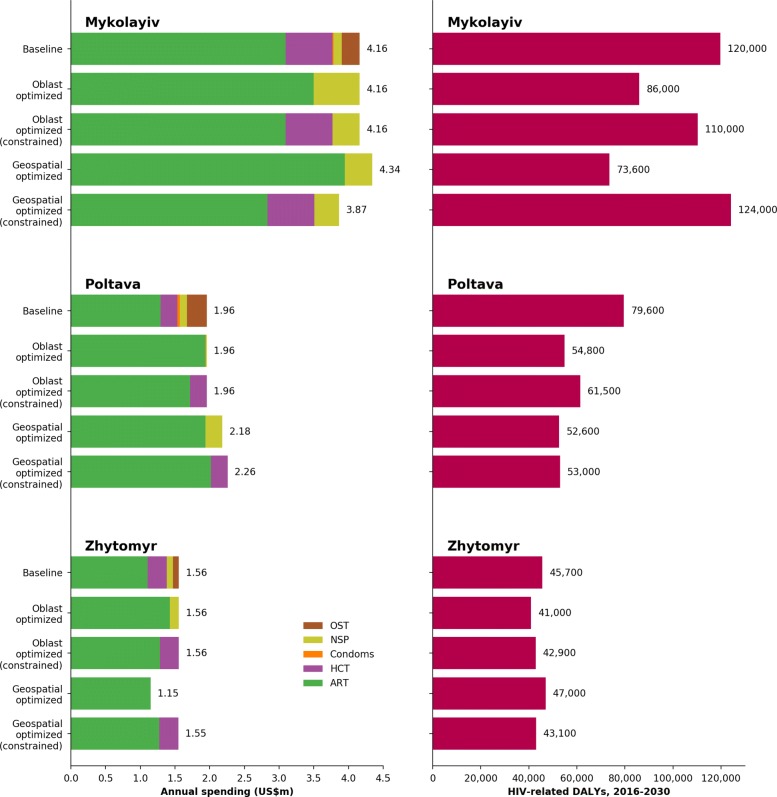
Results: Geographical optimization was found to identify solutions with better outcomes than would be possible by considering region-specific allocations alone. In the case of Ukraine, prior to optimization (i.e. with status quo spending), a total of 244,000 HIV-related disability-adjusted life years (DALYs) were estimated to occur from 2016 to 2030 across the three oblasts. With optimization within (but not between) oblasts, this was estimated to be reduced to 181,000. With geographical optimization (i.e., allowing reallocation of funds between oblasts), this was estimated to be further reduced to 173,000.

Conclusions: With the increasing availability of region- and even facility-level data, geographical optimization is likely to play an increasingly important role in health economic decision making. Although the largest gains are typically due to reallocating resources to the most effective interventions, especially treatment, further gains can be achieved by optimally reallocating resources between regions. Finally, the methods described here are not restricted to geographical optimization, and can be applied to other problems where competing resources need to be allocated with constraints, such as between diseases.

Keywords: Allocative efficiency; Geographical; Modeling; Optimization; Resource allocation; Ukraine.


Conflict of interest statement

The authors declare that they have no competing interests.

Figures

Fig. 1
Fig. 1
Oblasts of Ukraine used for the case study. Detailed epidemiological, expenditure, service, and delivery data were available for each oblast and were used to calibrate the Optima HIV model. These three oblasts (Zhytomyr, Poltava, and Mykolayiv) were chosen to represent low, medium, and high HIV prevalence regions, respectively. Map provided by and adapted with written permission from the USAID HIV Reform in Action Project [24]
Fig. 2
Fig. 2
Compartmental structure of the Optima HIV epidemic model. This diagram shows the compartmental structure for a single population (e.g., females aged 25-34; the entire structure is duplicated for each population). Horizontal arrows represent movements between care states, while vertical arrows represent movements between health states
Fig. 3
Fig. 3
Construction of the BOC for Mykolayiv. The first step is to optimize the baseline budget (top left), which improves the outcome (top right; here using the example of minimizing the number of new HIV infections). The total budget is then scaled up and down and re-optimized (middle), resulting in a “staircase” of outcomes that can then be interpolated, thereby forming the BOC, with spending on the x-axis and the outcome (new infections) on the y-axis (bottom). Abbreviations: ART, antiretroviral therapy; HCT, HIV counseling and testing; NSP, needle-syringe program; OST, opiate substitution therapy; BOC, budget-outcome curve
Fig. 4
Fig. 4
Example budget-outcome curves (BOCs). The top panel shows the BOC for each oblast, including the optimally-allocated annual baseline spending amount (circle) and the geographically-optimized annual spending amount (star) for the outcome of minimizing new HIV infections. The bottom panel shows the estimated cost per infection averted, which is the inverse of the negative first derivative of the BOC and effectively equivalent to a type of incremental cost-effectiveness ratio. Note that, at the optimum, this quantity is equal across the three BOCs
Fig. 5
Fig. 5
Solution-space hyperplane. Each axis shows the annual spending for each oblast, such that the total spending remains constant; the logarithmic color scale shows the ratio of the outcome for each possible inter-region allocation (here, the cumulative number of new HIV infections from 2016–2030), compared to the optimal inter-region allocation. In particular, outcomes are shown for the baseline allocation (circle) and the geographically-optimized allocation (star), indicating that the baseline inter-region allocation is already very close to optimal
Fig. 6
Fig. 6
Interface for running geographical optimizations. Yellow notes indicate the purpose of each section of the interface: the first section of the geographical analysis interface allows users to create a portfolio; the second section allows them to define regions, and the final section allows them to generate BOCs, run geographical optimization, and export the results. Image adapted from the public domain Optima HIV webapp, http://hiv.ocds.co
Fig. 7
Fig. 7
Nonlinearities in a hypothetical example of geographical optimization. Initial HIV prevalence (left) and the resultant optimal budget allocation (right) for 100 contiguous regions
Fig. 8
Fig. 8
Baseline and optimal budget allocations with corresponding outcomes for each oblast. Optimal budget allocations are shown for both intra-oblast optimization (where the budget for that oblast is the same as baseline) and for geographical optimization (where funding is allowed to shift between oblasts)

References

    1. Schwartländer B, Stover J, Hallett T, Atun R, Avila C, Gouws E, Bartos M, Ghys PD, Opuni M, Barr D, et al. Towards an improved investment approach for an effective response to HIV/AIDS. Lancet. 2011;377(9782):2031–41. doi: 10.1016/S0140-6736(11)60702-2. - DOI - PubMed
    1. HIV Modeling Consortium. Model Database. 2018. https://www.hivmodelling.org/countries/all-models. Accessed 20 Sept 2019.
    1. Kahn J, Bollinger L, Stover J, Marseille E. Using models to guide HIV/AIDS policy: a synthesis of current models to determine resource allocation cost-effectiveness. In: Holmes K, Bertozzi S, Bloom B, Jha P, Nugent R, editors. Disease Control Priorities. DC: World Bank; 2016.
    1. Eaton JW, Menzies NA, Stover J, Cambiano V, Chindelevitch L, Cori A, Hontelez JA, Humair S, Kerr CC, Klein DJ, et al. Health benefits, costs, and cost-effectiveness of earlier eligibility for adult antiretroviral therapy and expanded treatment coverage: a combined analysis of 12 mathematical models. Lancet Global Health. 2014;2(1):23–34. doi: 10.1016/S2214-109X(13)70172-4. - DOI - PMC - PubMed
    1. Meyer-Rath G, McGillen JB, Cuadros DF, Hallett TB, Bhatt S, Wabiri N, Tanser F, Rehle T. Targeting the right interventions to the right people and places: the role of geospatial analysis in HIV program planning. AIDS. 2018;32(8):957. - PMC - PubMed