Deep Learning Approaches Predict Glaucomatous Visual Field Damage from OCT Optic Nerve Head En Face Images and Retinal Nerve Fiber Layer Thickness Maps
- PMID: 31718841
- PMCID: PMC8063221
- DOI: 10.1016/j.ophtha.2019.09.036
Deep Learning Approaches Predict Glaucomatous Visual Field Damage from OCT Optic Nerve Head En Face Images and Retinal Nerve Fiber Layer Thickness Maps
Abstract
Purpose: To develop and evaluate a deep learning system for differentiating between eyes with and without glaucomatous visual field damage (GVFD) and predicting the severity of GFVD from spectral domain OCT (SD OCT) optic nerve head images.
Design: Evaluation of a diagnostic technology.
Participants: A total of 9765 visual field (VF) SD OCT pairs collected from 1194 participants with and without GVFD (1909 eyes).
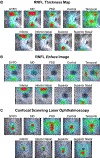
Methods: Deep learning models were trained to use SD OCT retinal nerve fiber layer (RNFL) thickness maps, RNFL en face images, and confocal scanning laser ophthalmoscopy (CSLO) images to identify eyes with GVFD and predict quantitative VF mean deviation (MD), pattern standard deviation (PSD), and mean VF sectoral pattern deviation (PD) from SD OCT data.
Main outcome measures: Deep learning models were compared with mean RNFL thickness for identifying GVFD using area under the curve (AUC), sensitivity, and specificity. For predicting MD, PSD, and mean sectoral PD, models were evaluated using R2 and mean absolute error (MAE).
Results: In the independent test dataset, the deep learning models based on RNFL en face images achieved an AUC of 0.88 for identifying eyes with GVFD and 0.82 for detecting mild GVFD significantly (P < 0.001) better than using mean RNFL thickness measurements (AUC = 0.82 and 0.73, respectively). Deep learning models outperformed standard RNFL thickness measurements in predicting all quantitative VF metrics. In predicting MD, deep learning models based on RNFL en face images achieved an R2 of 0.70 and MAE of 2.5 decibels (dB) compared with 0.45 and 3.7 dB for RNFL thickness measurements. In predicting mean VF sectoral PD, deep learning models achieved high accuracy in the inferior nasal (R2 = 0.60) and superior nasal (R2 = 0.67) sectors, moderate accuracy in inferior (R2 = 0.26) and superior (R2 = 0.35) sectors, and lower accuracy in the central (R2 = 0.15) and temporal (R2 = 0.12) sectors.
Conclusions: Deep learning models had high accuracy in identifying eyes with GFVD and predicting the severity of functional loss from SD OCT images. Accurately predicting the severity of GFVD from SD OCT imaging can help clinicians more effectively individualize the frequency of VF testing to the individual patient.
Copyright © 2019 American Academy of Ophthalmology. Published by Elsevier Inc. All rights reserved.
Figures


Comment in
-
Reply.Ophthalmology. 2022 Jan;129(1):e5. doi: 10.1016/j.ophtha.2021.08.022. Epub 2021 Oct 7. Ophthalmology. 2022. PMID: 34629192 No abstract available.
-
Re: Christopher et al.: Deep learning approaches predict glaucomatous visual field damage from OCT optic nerve head en face images and retinal nerve fiber layer thickness maps (Ophthalmology. 2020;127:346-356).Ophthalmology. 2022 Jan;129(1):e4-e5. doi: 10.1016/j.ophtha.2021.07.035. Epub 2021 Oct 7. Ophthalmology. 2022. PMID: 34629193 No abstract available.
References
-
- Shaikh Y, Yu F, Coleman AL. Burden of undetected and untreated glaucoma in the United States. Am J Ophthalmol. 2014;158(6):1121–1129. - PubMed
-
- Russell RA, Crabb DP, Malik R, Garway-Heath DF. The relationship between variability and sensitivity in large-scale longitudinal visual field data. Investig Ophthalmol Vis Sci. 2012;53(10):5985–5990. - PubMed
-
- Wall M, Woodward KR, Doyle CK, Artes PH. Repeatability of automated perimetry: A comparison between standard automated perimetry with stimulus size III and V, matrix, and motion perimetry. Investig Ophthalmol Vis Sci. 2009;50(2):974–979. - PubMed
Publication types
MeSH terms
Grants and funding
LinkOut - more resources
Full Text Sources
Other Literature Sources
Medical
Research Materials
Miscellaneous

