. 2019 Nov 12;4(6):e00438-19.
doi: 10.1128/mSystems.00438-19.

Association of Flavonifractor plautii, a Flavonoid-Degrading Bacterium, with the Gut Microbiome of Colorectal Cancer Patients in India

Affiliations

Association of Flavonifractor plautii, a Flavonoid-Degrading Bacterium, with the Gut Microbiome of Colorectal Cancer Patients in India

Ankit Gupta et al. mSystems. .

Abstract

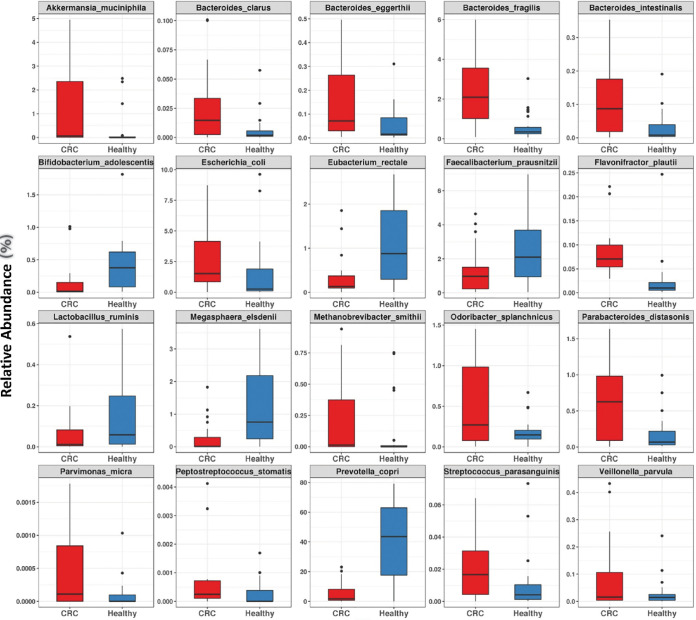
Recently, dysbiosis in the human gut microbiome and shifts in the relative abundances of several bacterial species have been recognized as important factors in colorectal cancer (CRC). However, these studies have been carried out mainly in developed countries where CRC has a high incidence, and it is unclear whether the host-microbiome relationships deduced from these studies can be generalized to the global population. To test if the documented associations between the microbiome and CRC are conserved in a distinct context, we performed metagenomic and metabolomic association studies on fecal samples from 30 CRC patients and 30 healthy controls from two different locations in India, followed by a comparison of CRC data available from other populations. We confirmed the association of Bacteroides and other bacterial taxa with CRC that have been previously reported in other studies. However, the association of CRC with Flavonifractor plautii in Indian patients emerged as a novel finding. The plausible role of F. plautii appears to be linked with the degradation of beneficial anticarcinogenic flavonoids, which was also found to be significantly correlated with the enzymes and modules involved in flavonoid degradation within Indian CRC samples. Thus, we hypothesize that the degradation of beneficial flavonoids might be playing a role in cancer progression within this Indian cohort. We also identified 20 potential microbial taxonomic markers and 33 potential microbial gene markers that discriminate the Indian CRC from healthy microbiomes with high accuracy based on machine learning approaches.IMPORTANCE This study provides novel insights on the CRC-associated microbiome of a unique cohort in India, reveals the potential role of a new bacterium in CRC, and identifies cohort-specific biomarkers, which can potentially be used in noninvasive diagnosis of CRC. The study gains additional significance, as India is among the countries with a very low incidence of CRC, and the diet and lifestyle in India have been associated with a distinct gut microbiome in healthy Indians compared to other global populations. Thus, in this study, we hypothesize a unique relationship between CRC and the gut microbiome in an Indian population.

Keywords: Flavonifractor plautii; biomarkers; colorectal cancer; gut microbiome.


Figures

FIG 1
FIG 1
Variations in intersample and intrasample diversity between healthy and CRC samples. (A) Rarefaction curves based on gene counts at each sample depth in healthy and CRC individuals are shown using the box plot. (B) Richness of microbial communities revealed using Shannon diversity is shown for healthy and CRC samples. (C) Intersample Bray-Curtis distances showing diversity between CRC and healthy samples are shown using the box plot. The boxes represent interquartile range between the first (25th percentile) and third (75th percentile) quartiles, and the line or notch in the boxes represents the median. The whiskers extending 1.5× interquartile range on both sides represent the deviations in the values from the median.
FIG 2
FIG 2
The 20 differentially abundant species between healthy and CRC samples. The box plots showing 20 differentially abundant species observed using all three methods of species identification between CRC (red) and healthy (blue) samples are represented in panels. The y axis represents relative abundance of samples calculated by mapping the reads against reference genomes collected from HMP-NCBI. The boxes represent interquartile ranges between the first (25th percentile) and third (75th percentile) quartiles, and the line or notch in the boxes represents the median. The whiskers extending 1.5× interquartile range on both sides represent the deviations in the values from the median.
FIG 3
FIG 3
Species involved in gut microbial dysbiosis associated with colorectal cancer. The cooccurrence network derived from Spearman’s rank correlation coefficient using the relative abundance of 20 differentially abundant species is shown. The 14 species which are enriched in CRC individuals and 6 species which are enriched in healthy individuals are shown. Significant correlations (ρ > 0.5 and FDR-adjusted P < 0.05) are shown using network analysis. The node size shows the association of each species with other species. The node color shows the taxonomic families to which they belong.
FIG 4
FIG 4
Major effects of CRC on gut microbiome from multivariate meta-analysis. Principal-component analysis of the samples from China, Austria, and India using MGS abundance derived from metagenome-wide association study is projected. The multivariate analysis using distance-based redundancy analysis (db-RDA) was constrained by studies/populations and health status. The marginal box plots show separation of constrained projected coordinates on the x axis (constrained for studies/populations) and y axis (constrained for health status). The top three MGS that showed significant association with Indian CRC samples are interpolated on the plane of maximal separation.
FIG 5
FIG 5
(A) Principal-component analysis of the raw metabolomic peaks identified from CRC and healthy samples (n = 18). The PC1 and PC2 explaining almost 80% of variation between samples show distinct metabolomic profiles in CRC and healthy individuals. (B) Volcano plot showing the significantly enriched metabolites in CRC and healthy individuals. The fold change was calculated as log fold between CRC and healthy individuals. The adjusted P values are plotted on the y axis. The metabolites significantly enriched in CRC patients (adjusted P value < 0.05; fold change < −2) are shown in red whereas those enriched in healthy individuals (adjusted P value < 0.05; fold change > 2) are shown in blue. Valeric acid, butanoic acid, and 4-hydroxyphenyl acetic acid were observed to be significantly higher in CRC patients than in healthy individuals.
FIG 6
FIG 6
Association of 33 gene markers with the health status and taxonomic species identified. (A) Principal-component analysis based on abundances of 33 gene markers explains 40% of variation using only the first two principal components. (B) Association of 33 gene markers with the 20 taxonomic species identified using three different strategies. (C) CRC index computed using the log abundances of the 33 gene markers showing significant association only in the Indian CRC and healthy samples compared to Chinese and Austrian cohorts.

References

    1. Siegel RL, Miller KD, Fedewa SA, Ahnen DJ, Meester RG, Barzi A, Jemal A. 2017. Colorectal cancer statistics, 2017. CA Cancer J Clin 67:177–193. doi:10.3322/caac.21395. - DOI - PubMed
    1. Hisamuddin IM, Yang VW. 2006. Molecular genetics of colorectal cancer: an overview. Curr Colorectal Cancer Rep 2:53–59. doi:10.1007/s11888-006-0002-2. - DOI - PMC - PubMed
    1. Saxena R, Sharma V. 2015. A metagenomic insight into the human microbiome: its implications in health and disease, p 107–119. In Kumar D, Antonarakis S (ed), Medical and health genomics. Elsevier, New York, NY.
    1. Pulikkan J, Maji A, Dhakan DB, Saxena R, Mohan B, Anto MM, Agarwal N, Grace T, Sharma VK. 2018. Gut microbial dysbiosis in Indian children with autism spectrum disorders. Microb Ecol 76:1102–1114. doi:10.1007/s00248-018-1176-2. - DOI - PubMed
    1. Maji A, Misra R, Dhakan DB, Gupta V, Mahato NK, Saxena R, Mittal P, Thukral N, Sharma E, Singh A, Virmani R, Gaur M, Singh H, Hasija Y, Arora G, Agrawal A, Chaudhry A, Khurana JP, Sharma VK, Lal R, Singh Y. 2018. Gut microbiome contributes to impairment of immunity in pulmonary tuberculosis patients by alteration of butyrate and propionate producers. Environ Microbiol 20:402–419. doi:10.1111/1462-2920.14015. - DOI - PubMed

LinkOut - more resources