. 2019 Dec 27;294(52):20135-20147.
doi: 10.1074/jbc.RA119.009093. Epub 2019 Nov 12.

Monocarboxylate transporter 4 (MCT4) is a high affinity transporter capable of exporting lactate in high-lactate microenvironments

Affiliations

Monocarboxylate transporter 4 (MCT4) is a high affinity transporter capable of exporting lactate in high-lactate microenvironments

Yasna Contreras-Baeza et al. J Biol Chem. .

Abstract

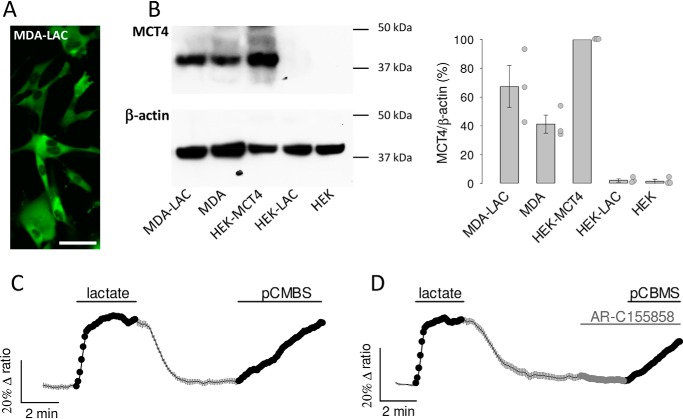
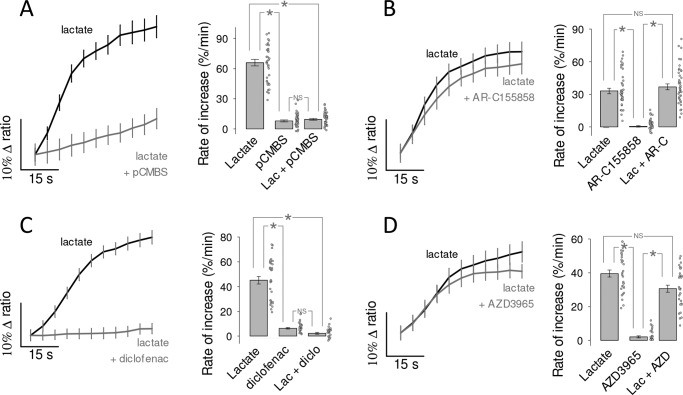
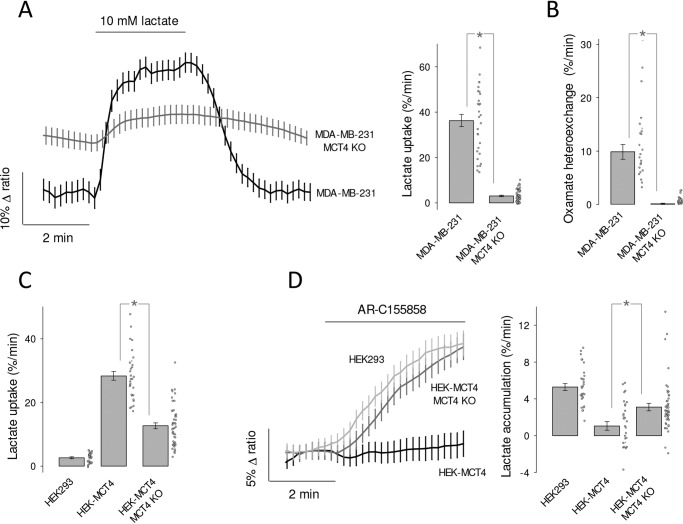
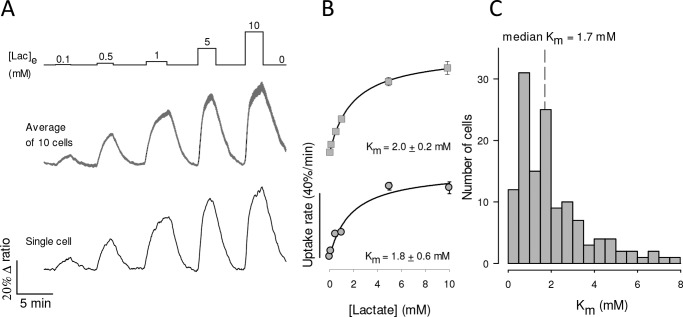
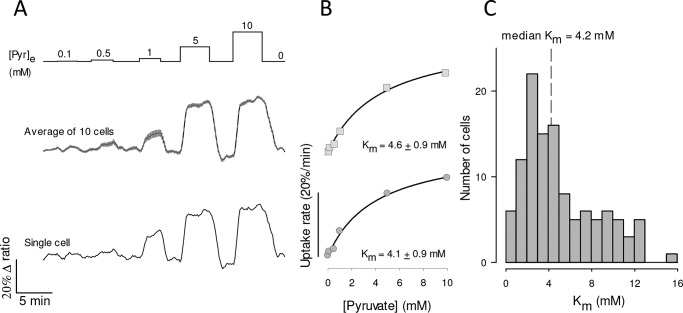
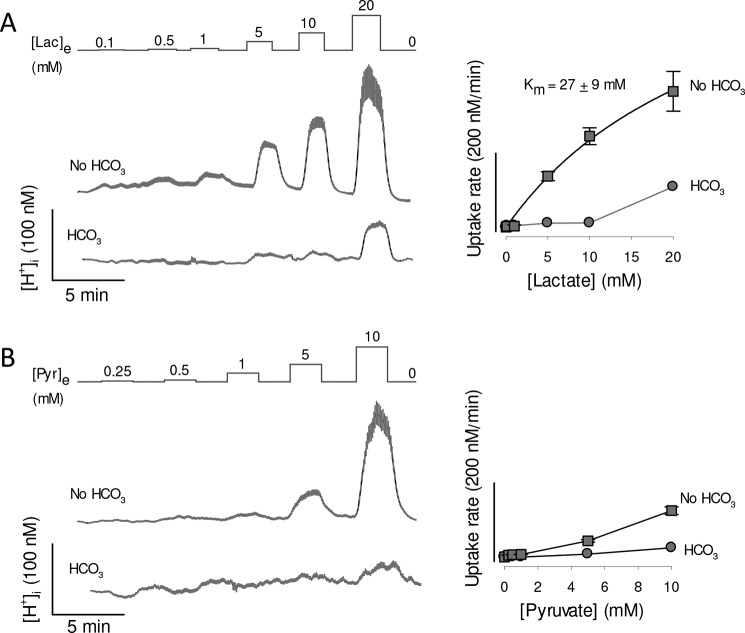
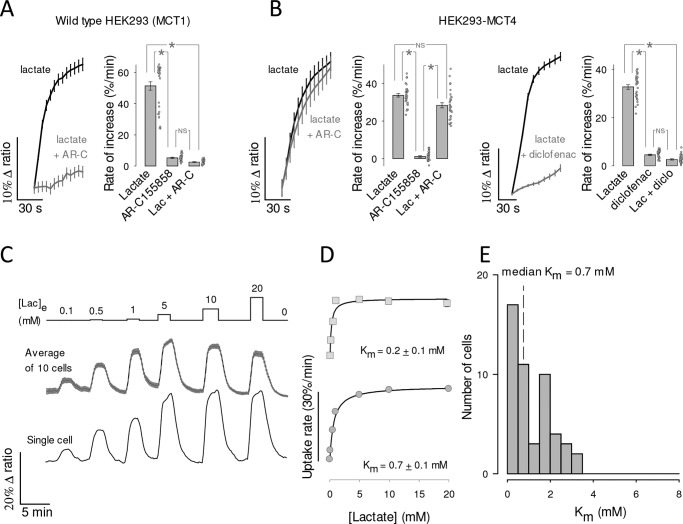
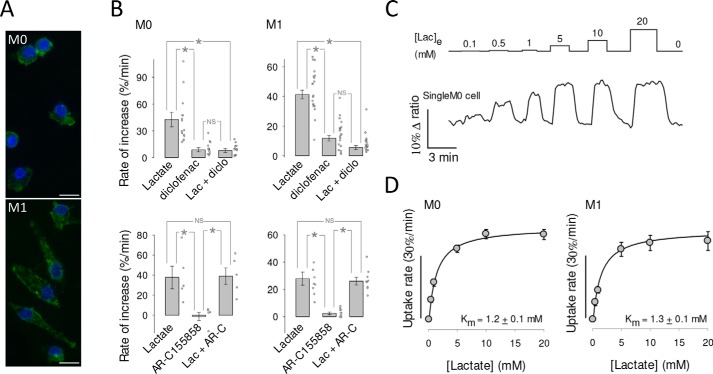
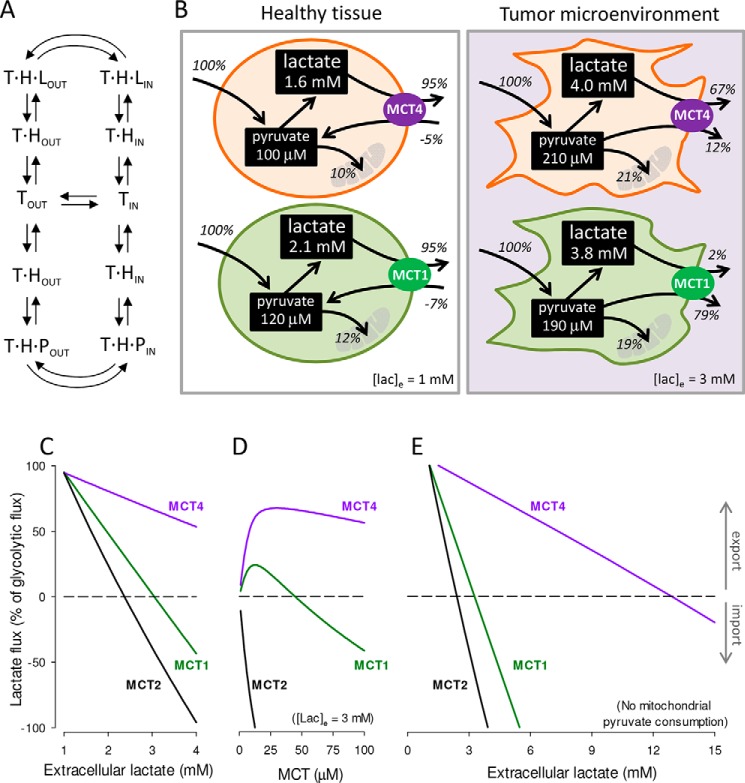
Monocarboxylate transporter 4 (MCT4) is an H+-coupled symporter highly expressed in metastatic tumors and at inflammatory sites undergoing hypoxia or the Warburg effect. At these sites, extracellular lactate contributes to malignancy and immune response evasion. Intriguingly, at 30-40 mm, the reported Km of MCT4 for lactate is more than 1 order of magnitude higher than physiological or even pathological lactate levels. MCT4 is not thought to transport pyruvate. Here we have characterized cell lactate and pyruvate dynamics using the FRET sensors Laconic and Pyronic. Dominant MCT4 permeability was demonstrated in various cell types by pharmacological means and by CRISPR/Cas9-mediated deletion. Respective Km values for lactate uptake were 1.7, 1.2, and 0.7 mm in MDA-MB-231 cells, macrophages, and HEK293 cells expressing recombinant MCT4. In MDA-MB-231 cells MCT4 exhibited a Km for pyruvate of 4.2 mm, as opposed to >150 mm reported previously. Parallel assays with the pH-sensitive dye 2',7'-bis-(carboxyethyl)-5-(and-6)-carboxyfluorescein (BCECF) indicated that previous Km estimates based on substrate-induced acidification were severely biased by confounding pH-regulatory mechanisms. Numerical simulation using revised kinetic parameters revealed that MCT4, but not the related transporters MCT1 and MCT2, endows cells with the ability to export lactate in high-lactate microenvironments. In conclusion, MCT4 is a high-affinity lactate transporter with physiologically relevant affinity for pyruvate.

Keywords: Michaelis-Menten; cancer; macrophage; metabolism; monocarboxylate transporter; pyruvate; transporter.


Conflict of interest statement

The authors declare that they have no conflicts of interest with the contents of this article

Figures

Figure 1.
Figure 1.
MCT4 mediates tonic lactate efflux in MDA-MB-231 cells. A, MDA-MB-231 cells constitutively expressing the lactate sensor Laconic (MDA-LAC). Bar represents 50 μm. B, immunodetection of MCT4 and β-actin in extracts from: MDA-LAC, WT MDA-MB-231 cells (MDA), HEK293 cells transiently expressing MCT4 (HEK-MCT4), HEK293 cells transiently expressing Laconic (HEK-LAC) and WT HEK293 cells (HEK). Position of molecular weight standards is shown. Bar graph shows mean ± S.E. (3 separate preparations). C and D, MDA-MB-231 cells expressing Laconic were exposed to 10 mm lactate and then to 1 μm AR-C155858 and/or 250 μm pCMBS as indicated, mean ± S.E. (10 cells from single experiments, representative of three experiments for each protocol).
Figure 2.
Figure 2.
MCT4 mediates the influx of lactate in MDA-MB-231 cells. The uptake of 10 mm lactate by MDA-LAC cells was monitored before and during exposure to MCT inhibitors, mean ± S.E. (10 cells from single experiments). Bar graphs show the initial rates of uptake and the rate of accumulation elicited by the inhibitor itself, mean ± S.E. (30 cells in three experiments). *, p < 0.05 in the Tukey's test. NS, nonsignificant. A, 250 μm pCBMS, inhibits MCT1 and MCT4. B, 1 μm AR-C155858, inhibits MCT1 and MCT2. C, 1 mm diclofenac, inhibits MCT1 and MCT4. D, 10 μm AZD3965, inhibits MCT1 and MCT2.
Figure 3.
Figure 3.
Effect of genetic MCT4 deletion on lactate dynamics in MDA-MB-231 and HEK-MCT4 cells. A, WT and MCT4-KO MDA-MB-231 cells were exposed to 10 mm lactate, as indicated. Data are from 10 cells from representative experiments (mean ± S.E.). Note that MCT4-KO cells maintain a higher resting lactate concentration. Bar graphs show rates of lactate uptake (mean ± S.E. of 30–50 cells in three experiments; *, p < 0.05 in the Mann-Whitney test). B, lactate efflux from WT and MCT4-KO MDA-MB-231 cells was monitored immediately after extracellular lactate (1 mm) was replaced by 6 mm sodium oxamate (mean ± S.E. of 30–50 cells in three experiments; *, p < 0.05 in the Mann-Whitney test). C, the uptake of 10 mm lactate in the presence of 1 μm AR-C155858 was measured in HEK293, HEK-MCT4, and HEK-MCT4-MCT4KO cells. Data from 30 cells in three experiments (mean ± S.E.; *, p < 0.05 in the Mann-Whitney test). D, HEK293, HEK-MCT4 and HEK-MCT4-MCT4-KO cells were exposed to 1 μm AR-C155858 in the presence of 2 mm glucose. Data are from 10 cells from representative experiments (mean ± S.E.). Bar graphs summarize the results of three experiments (mean ± S.E. of 30–50 cells in three experiments; *, p < 0.05 in the Mann-Whitney test).
Figure 4.
Figure 4.
High affinity lactate transport in MDA-MB-231 cells. A, MDA-LAC cells were exposed to increasing concentrations of lactate, from 0.1 to 10 mm, as indicated. Responses of intracellular lactate in a single cell (bottom) and in 10 cells from a representative experiment (mean ± S.E., top) are shown. B, dose-response of the initial rate of lactate uptake, from the same cells depicted in A. Mean ± S.E. Km values were obtained by fitting a rectangular hyperbola to the data. C, frequency distribution of Km determinations from 133 cells in 10 experiments. Median Km was 1.7 mm.
Figure 5.
Figure 5.
High affinity pyruvate uptake in MDA-MB-231 cells. A, MDA-MB-231 cells expressing pyronic were exposed to increasing concentrations of pyruvate, from 0.1 to 10 mm, as indicated. The responses of a single cell (bottom) and 10 cells from a single experiment (mean ± S.E., top) are shown. B, dose-response of the initial rate of pyruvate uptake, from the same cells depicted in A. Mean ± S.E. and Km values were obtained by fitting a rectangular hyperbola to the data. C, frequency distribution of Km determinations from 117 cells in 13 experiments. The median Km in this series was 4.2 mm.
Figure 6.
Figure 6.
Lactate- and pyruvate-induced acidification in MDA-MB-231 cells. MDA-MB-231 cells were loaded with the pH-sensitive probe BCECF, which was calibrated as described under “Experimental procedures.” Resting proton concentrations ranged between 36 and 45 nm (pH 7.35 to 7.44). A, cells were exposed to increasing concentrations of lactate, from 0.1 to 20 mm, in the presence and absence of 24 mm HCO3, equimolarly replaced by HEPES. Traces show intracellular proton concentration of 10 cells (mean ± S.E.) in a single experiment, representative of three. Dose-responses of the rates of acidification are shown in the right graph. The Km was obtained by fitting a rectangular hyperbola to the data in the absence of bicarbonate. B, cells were exposed to increasing concentrations of pyruvate, from 0.25 to 10 mm, in the presence and absence of 24 mm HCO3, equimolarly replaced by HEPES. Traces show intracellular proton concentration of 10 cells (mean ± S.E.) in a single experiment, representative of three. Dose-responses of the rates of acidification are shown in the right graph.
Figure 7.
Figure 7.
High affinity lactate transport in HEK293 cells overexpressing recombinant MCT4. A, HEK293 cells expressing Laconic were exposed to 10 mm lactate in the presence and absence of 1 μm AR-C155858 (mean ± S.E. of 10 cells). The bar graph summarizes the results of three experiments (mean ± S.E. of 30 cells; *, p < 0.05 in the Tukey′s test. NS, nonsignificant). B, HEK293 cells co-expressing MCT4 and Laconic were exposed to 10 mm lactate in the presence and absence of 1 μm AR-C155858 (left panel) or 1 mm diclofenac (right panel), mean ± S.E. of 10 cells. Bar graphs summarize the results of three experiments (mean ± S.E. of 30 cells; *, p < 0.05 in the Tukey's test). C, HEK293 cells co-expressing MCT4 and Laconic were exposed to increasing concentrations of lactate, from 0.1 to 10 mm, as indicated. Responses of intracellular lactate in a single cell (bottom) and in 10 cells from a representative experiment (mean ± S.E., top) are shown. D, dose-response of the initial rate of lactate uptake, from the same cells depicted in C. Km values were obtained by fitting a rectangular hyperbola to the data. E, frequency distribution from 50 cells in five experiments. Median Km was 0.7 mm.
Figure 8.
Figure 8.
High affinity lactate transport in human macrophages. A, undifferentiated (M0) and polarized (M1) macrophages immunostained for MCT4 (green). 4′,6-Diamidino-2-phenylindole (DAPI)-stained nuclei are shown in blue. Bar represents 10 μm. B, the uptake of 1 mm lactate by macrophages was monitored before and during exposure to MCT inhibitors diclofenac (0.5 mm; diclo) or AR-C155858 (1 μm; AR-C). Bar graphs show the initial rates of uptake and the rate of accumulation elicited by the inhibitor itself. Mean ± S.E., 5–20 cells in at least three experiments of each type (*, p < 0.05 in the Tukey's test; NS, nonsignificant) is shown. C, macrophages were exposed to increasing concentrations of lactate, from 0.1 to 20 mm, as indicated. The trace shows the response of an individual M0 macrophage. D, Km values were obtained by fitting a rectangular hyperbola to the data. Mean ± S.E. of 11 cells in three experiments (M0) and 10 cells in three experiments (M1). A pool of M0 and M1 gave a Km of 1.2 ± 0.1 mm (21 cells in six experiments).
Figure 9.
Figure 9.
MCT4 is capable of lactate release in high lactate microenvironments. A, alternating conformer model of MCTs. The transporter (T) binds a proton (H) before binding either lactate (L) or pyruvate (P). Only empty and fully-loaded transporters alternate between outward-facing (out) and inward-facing (in) conformations. B, simulation of highly glycolytic cells. Glycolytic flux was fixed at 10 μm/s (100%). Rate constants were 0.01 s−1 (mitochondrial pyruvate import), 0.5 s−1 (LDH forward), and 0.025 s−1 (LDH reverse). Transporter quantities were 40 μm (MCT4), 42 μm (MCT1), and 3.8 μm (MCT2). Dynamics were simulated as specified under “Experimental procedures.” Extracellular lactate was 1 mm (left panel, healthy tissue) or 3 mm (right panel, tumor microenvironment). Extracellular pyruvate was 0.1 mm for both conditions. Fluxes are given as percentage of the glycolytic flux. C, effect of increasing extracellular lactate on lactate flux through MCT1, MCT2, and MCT4, starting from the conditions in B, left panel (healthy tissue). D, effect of increasing transporter dosage on lactate flux through MCT1, MCT2, and MCT4 at 3 mm extracellular lactate (tumor microenvironment). E, effect of increasing extracellular lactate on lactate flux through MCT1, MCT2, and MCT4 in the absence of mitochondrial pyruvate influx.

Similar articles

Cited by

References

    1. Warburg O. (1925) The metabolism of carcinoma cells. J. Cancer Res. 9, 148–163 10.1158/jcr.1925.148 - DOI
    1. Racker E. (1972) Bioenergetics and the problem of tumor growth. Am. Sci. 60, 56–63 - PubMed
    1. Vander Heiden M. G., Cantley L. C., and Thompson C. B. (2009) Understanding the Warburg effect: the metabolic requirements of cell proliferation. Science 324, 1029–1033 10.1126/science.1160809 - DOI - PMC - PubMed
    1. San-Millán I., and Brooks G. A. (2017) Reexamining cancer metabolism: lactate production for carcinogenesis could be the purpose and explanation of the Warburg Effect. Carcinogenesis 38, 119–133 - PMC - PubMed
    1. Liberti M. V., and Locasale J. W. (2016) The Warburg EFfect: how does it benefit cancer cells? Trends Biochem. Sci. 41, 211–218 10.1016/j.tibs.2015.12.001 - DOI - PMC - PubMed

Publication types

MeSH terms