. 2019 Nov 26;116(48):24242-24251.
doi: 10.1073/pnas.1907883116. Epub 2019 Nov 12.

Single-cell transcriptomics reveals expansion of cytotoxic CD4 T cells in supercentenarians

Affiliations

Single-cell transcriptomics reveals expansion of cytotoxic CD4 T cells in supercentenarians

Kosuke Hashimoto et al. Proc Natl Acad Sci U S A. .

Abstract

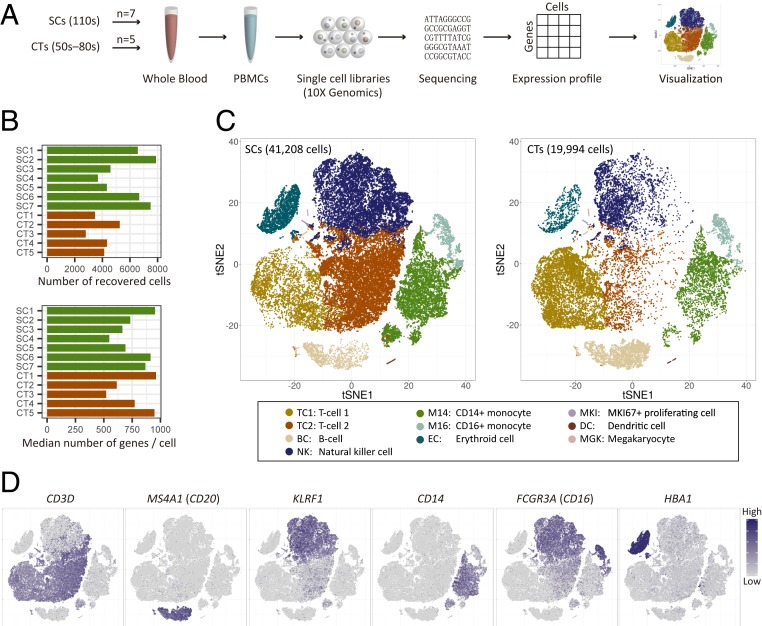
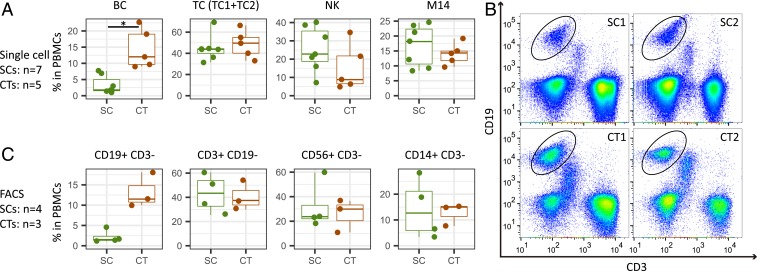
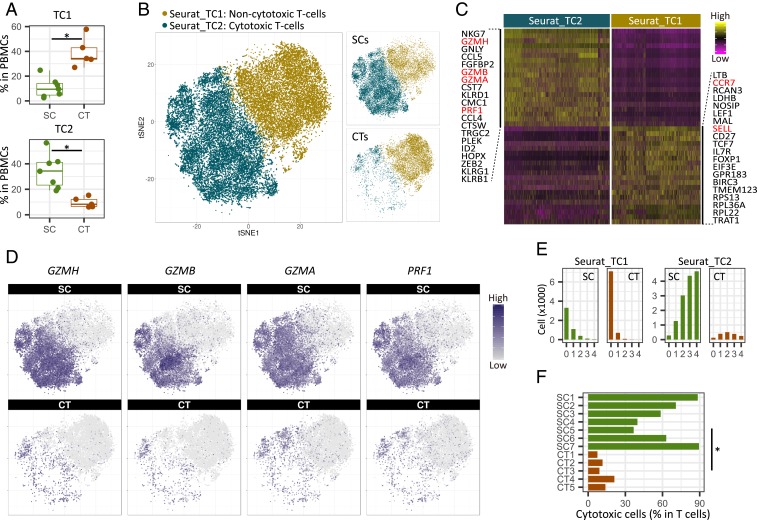
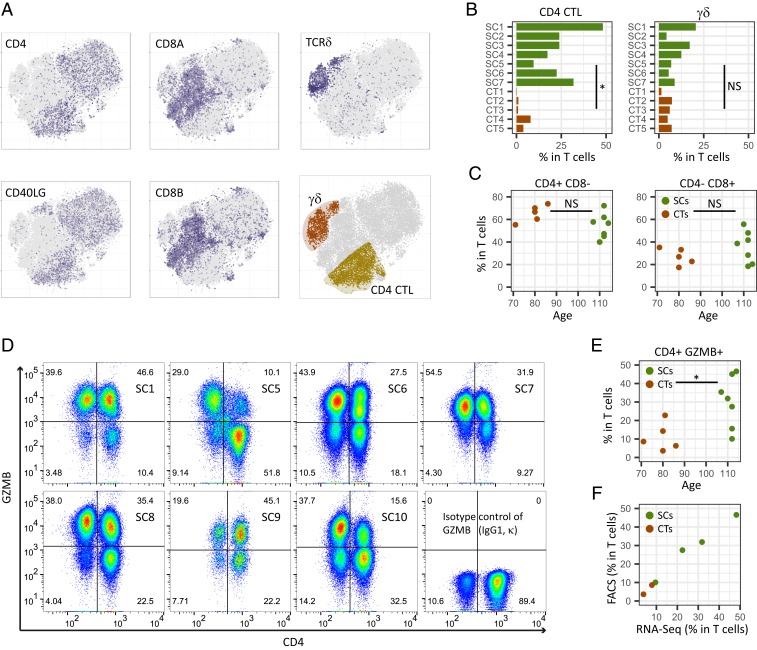
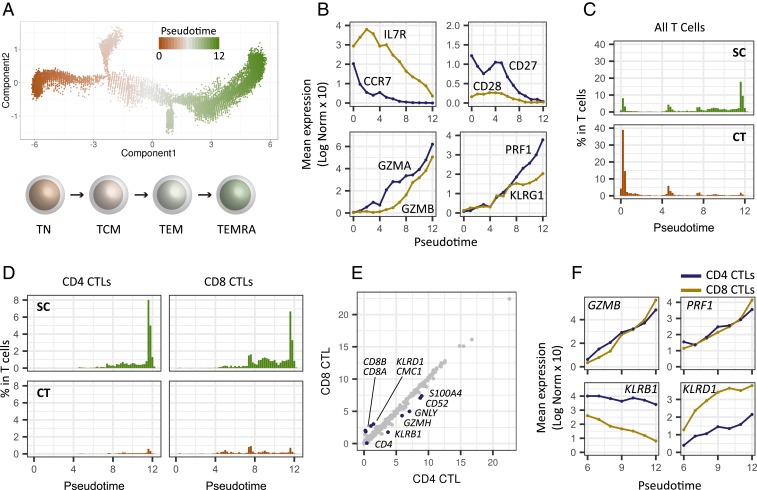
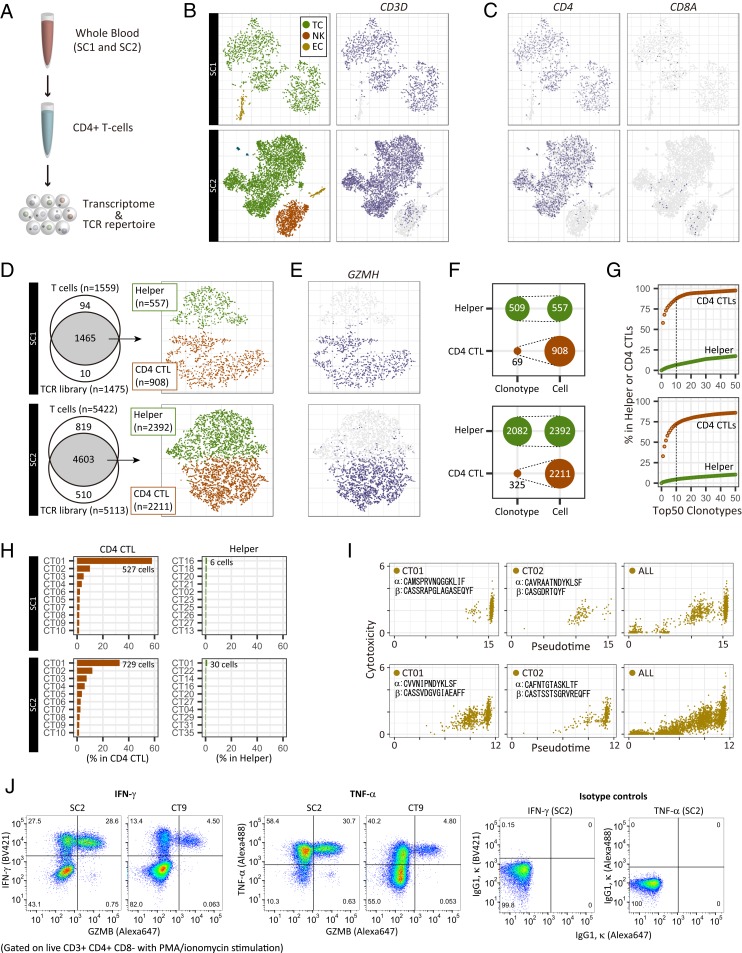
Supercentenarians, people who have reached 110 y of age, are a great model of healthy aging. Their characteristics of delayed onset of age-related diseases and compression of morbidity imply that their immune system remains functional. Here we performed single-cell transcriptome analysis of 61,202 peripheral blood mononuclear cells (PBMCs), derived from 7 supercentenarians and 5 younger controls. We identified a marked increase of cytotoxic CD4 T cells (CD4 cytotoxic T lymphocytes [CTLs]) as a signature of supercentenarians. Furthermore, single-cell T cell receptor sequencing of 2 supercentenarians revealed that CD4 CTLs had accumulated through massive clonal expansion, with the most frequent clonotypes accounting for 15 to 35% of the entire CD4 T cell population. The CD4 CTLs exhibited substantial heterogeneity in their degree of cytotoxicity as well as a nearly identical transcriptome to that of CD8 CTLs. This indicates that CD4 CTLs utilize the transcriptional program of the CD8 lineage while retaining CD4 expression. Indeed, CD4 CTLs extracted from supercentenarians produced IFN-γ and TNF-α upon ex vivo stimulation. Our study reveals that supercentenarians have unique characteristics in their circulating lymphocytes, which may represent an essential adaptation to achieve exceptional longevity by sustaining immune responses to infections and diseases.

Keywords: CD4 CTL; aging; centenarian; single-cell transcriptome.


Conflict of interest statement

The authors declare no competing interest.

Figures

Fig. 1.
Fig. 1.
Single-cell transcriptome profiling of PBMCs of supercentenarians and controls. (A) Schematic representation of single-cell transcriptome experiments, from blood sample collection to visualization. (B) The number of recovered cells that passed quality control and the median number of genes per cell for each of the donors (7 supercentenarians, SC1−SC7; and 5 controls, CT1–CT5). (C) Two-dimensional tSNE visualization of PBMCs for supercentenarians (Left) and controls (Right). Different colors represent 10 clusters (cell types) defined by the k-means clustering algorithm. (D) Expression of marker genes for 6 major cell types; cell positions are from the tSNE plot in C.
Fig. 2.
Fig. 2.
Significant reduction of B cells in supercentenarians. (A) Boxplots of the percentage of each cell type (defined by single-cell RNA-Seq) in PBMCs of 7 supercentenarians (SC1–SC7) and 5 controls (CT1–CT5)—the boxes extend from the 25th to 75th percentile and encompass the median (horizontal line). BC, B cell; TC, T cell; NK, natural killer cell; M14, CD14+ monocyte. *P < 0.05 (Wilcoxon rank sum test); no asterisk means not significant. (B) Representative FACS plots showing CD19+ B cells; the plots for other donors are shown in SI Appendix, Fig. S2B. (C) Boxplots of the percentage of each cell type (defined by FACS) in PBMCs of 4 supercentenarians SC1–SC4 and 3 controls CT1–CT3. No asterisk means not significant (Wilcoxon rank sum test).
Fig. 3.
Fig. 3.
Expansion of cytotoxic T cells in supercentenarians. (A) Boxplots of percentages of TC1 and TC2 T cells (defined by k-means clustering of single cell RNA-Seq data) in PBMCs of 7 supercentenarians (SC1–SC7) and 5 controls (CT1–CT5). *P < 0.05 (Wilcoxon rank sum test). (B) Two-dimensional tSNE visualization of T cells using the Seurat R package. Different colors represent 2 clusters (Seurat_TC1 and Seurat_TC2), similar to the original TC1 and TC2 clusters. Right (Top and Bottom) show supercentenarians and controls, respectively. (C) Top 20 genes significantly highly expressed in Seurat_TC2 (Left) and Seurat_TC1 (Right). Major cytotoxic effector genes and lymph node homing markers are shown in red. (D) Expression of cytotoxic genes in supercentenarians (Top) and controls (Bottom); cell positions are from the tSNE plot in B. (E) Number of detected genes out of 4 cytotoxic genes (GZMH, GZMB, GZMA, and PRF1) per cell. (F) Percentage of cytotoxic T cells (cells clustered in TC2) among the total T cells. *P < 0.05 (Wilcoxon rank sum test).
Fig. 4.
Fig. 4.
Expansion of cytotoxic CD4 T cells in supercentenarians. (A) Classification of cytotoxic T cells into 3 subtypes—CD4 CTLs, CD8 CTLs, and γδ T cells—was based on the expression of CD4, CD8, and TRDC (see also SI Appendix, Fig. S4A) in T cells of 7 supercentenarians (SC1–SC7) and 5 controls (CT1–CT5); cell positions are from the tSNE plot in Fig. 3B. (B) Percentages of CD4 CTLs and γδ T cells among the total T cells. *P < 0.05 (Wilcoxon rank sum test); NS, not significant. (C) Percentages of CD4+ T cells and CD8+ T cells in total T cells. NS, not significant (Wilcoxon rank sum test). (D) FACS profiles of 6 supercentenarians (SC1, SC5–7, and SC9) and 1 semisupercentenarian (SC8). Cells gated on CD3+ were profiled using CD4 (x axis) and GZMB or IgG1 κ as an isotype control (y axis). Cells in Top Right corners are CD4 CTLs. (E) Percentages of CD4+ GZMB+ cells among the total T cells of the 6 supercentenarians and 1 semisupercentenarian listed in D and 5 controls (CT4, CT5, and CT6–CT8). *P < 0.05 (Wilcoxon rank sum test). (F) Correlation between percentages of CD4 CTLs determined by RNA-Seq and FACS measurements. Each dot represents 1 donor, shown in green for supercentenarians (SC1, SC5–SC7) and red for controls (CT4, CT5).
Fig. 5.
Fig. 5.
The differentiation state of T cells for 7 supercentenarians (SC1–SC7) and 5 controls (CT1–CT5). (A) Pseudotime trajectory of T cells estimated using Monocle 2. A continuous value from 0 to 12 was assigned to each cell as a pseudotime. The Bottom shows the general scheme of T cell differentiation. TN, naïve; TCM, central memory; TEM, effector memory; and TEMRA, effector memory reexpressing CD45RA. (B) Expression transition of differentiation-associated genes along the pseudotime. (C) Percentages of T cells along the pseudotime for supercentenarians (SC) and controls (CT). (D) Percentages of CD4 and CT8 CTLs among the total T cells along the pseudotime. (E) Correlation of gene expression between CD4 and CD8 CTLs. (F) Expression transition of selected genes shown separately for CD4 and CD8 CTLs.
Fig. 6.
Fig. 6.
Single-cell transcriptome and TCR profiles of CD4+ T cells for 2 supercentenarians (SC1, Top; and SC2, Bottom). (A) Schematic representation of experiments for the single-cell transcriptome and TCR analysis. (B) Two-dimensional tSNE visualization of 3 cell types (TC, T cell; NK, natural killer cell; EC, erythroid cell), and CD3D expression (Right). (C) Expression of marker genes for CD4 and CD8 T cells; cell positions are from the tSNE plot in B. (D) T cells recovered in both transcriptome and TCR libraries. Recovered cells were clustered into helper T cells and CD4 CTLs, shown in the tSNE plot. (E) Expression of a marker gene for cytotoxic T cells; cell positions are from the tSNE plot in D. (F) Diversity of TCRs in helper T cells and CD4 CTLs. (G) Cumulative occupancy of the top 50 most abundant clonotypes. (H) Occupancy of the top 10 most abundant clonotypes. (I) Pseudotime and cytotoxicity of clonally expanded CD4 T cells. Cytotoxicity values indicate the mean expression of 5 cytotoxic genes: NKG7, GZMA, GZMB, GZMH, and PRF1. (J) FACS profiles of 1 supercentenarian (SC2) and 1 young control (CT9) upon PMA/ionomycin stimulation. Cells gated on live CD3+ CD4+ CD8 were profiled using GZMB or IgG1 κ (x axis) and IFN-γ, TNF-α, or IgG1 κ (y axis).

References

    1. Young R. D., Validated living worldwide supercentenarians, living and recently deceased: February 2018. Rejuvenation Res. 21, 67–69 (2018). - PubMed
    1. Pavlidis N., Stanta G., Audisio R. A., Cancer prevalence and mortality in centenarians: A systematic review. Crit. Rev. Oncol. Hematol. 83, 145–152 (2012). - PubMed
    1. Willcox D. C., et al. , Life at the extreme limit: Phenotypic characteristics of supercentenarians in Okinawa. J. Gerontol. A Biol. Sci. Med. Sci. 63, 1201–1208 (2008). - PubMed
    1. Evert J., Lawler E., Bogan H., Perls T., Morbidity profiles of centenarians: Survivors, delayers, and escapers. J. Gerontol. A Biol. Sci. Med. Sci. 58, 232–237 (2003). - PubMed
    1. Arai Y., et al. , Physical independence and mortality at the extreme limit of life span: Supercentenarians study in Japan. J. Gerontol. A Biol. Sci. Med. Sci. 69, 486–494 (2014). - PubMed

Publication types