

Precision and Normative Values of a New Computerized Chart for Contrast Sensitivity Testing
- PMID: 31719575
- PMCID: PMC6851081
- DOI: 10.1038/s41598-019-52987-9
Precision and Normative Values of a New Computerized Chart for Contrast Sensitivity Testing
Abstract
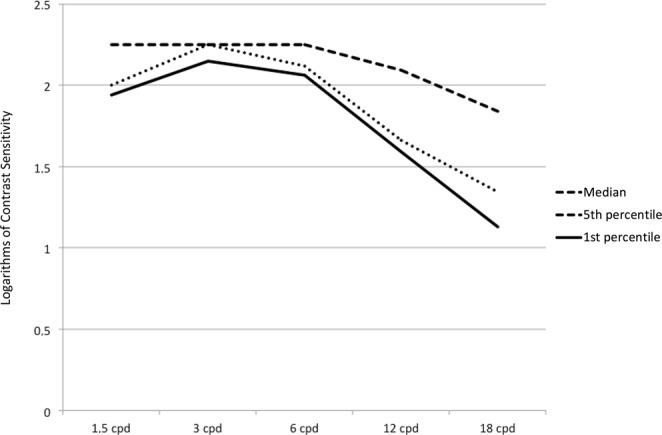
The purpose was to define a normative database for a grating test for contrast sensitivity, based on a chart monitor with high-definition liquid crystal display, and validate its measurements by assessing their repeatability and determining responsiveness to cataract surgery. Three samples were analyzed: (1) healthy volunteers to assess the repeatability of measurements, (2) healthy subjects to develop the normative database, (3) patients undergoing cataract surgery. All subjects were tested with the grating contrast sensitivity test (Vision Chart, CSO) at 1.5, 3, 6, 12 and 18 cycles per degree. The instrument software progressively reduces the contrast of the gratings according to the Quick Estimate by Sequential Testing (QUEST) procedure. In the subjects of the first sample, three consecutive measurements were taken and repeatability was assessed on the basis of the intra-session test-retest variability and the coefficient of variation. The test offered high repeatability, with test-retest variability ranging between 0.05 and 0.23 Log CS and the coefficient of variation between 0.61 and 4.21%. Normative data did not show a normal distribution. The highest median values were observed at 1.5, 3 and 6 cycles per degree frequencies. At these frequencies a ceiling effect was evident. In cataract patients, postoperative values showed an improvement at all spatial frequencies. In conclusion, the new contrast sensitivity test provides repeatable measurements that can be used for clinical purposes. In patients with healthy eyes and good vision, attention has to be paid to the ceiling effect.
Conflict of interest statement
The authors declare no competing interests.
Figures
References
Publication types
LinkOut - more resources
Full Text Sources
