. 2020 Mar;34(3):857-871.
doi: 10.1038/s41375-019-0628-0. Epub 2019 Nov 12.

Physiological levels of the PTEN-PI3K-AKT axis activity are required for maintenance of Burkitt lymphoma

Affiliations

Physiological levels of the PTEN-PI3K-AKT axis activity are required for maintenance of Burkitt lymphoma

Franziska Gehringer et al. Leukemia. 2020 Mar.

Abstract

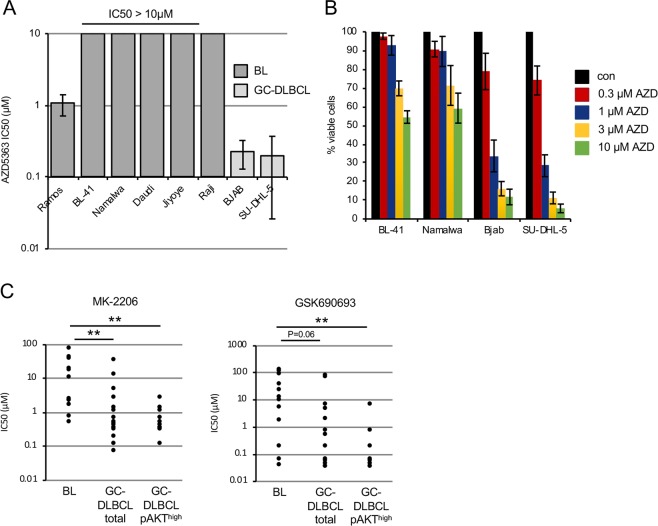
In addition to oncogenic MYC translocations, Burkitt lymphoma (BL) depends on the germinal centre (GC) dark zone (DZ) B cell survival and proliferation programme, which is characterized by relatively low PI3K-AKT activity. Paradoxically, PI3K-AKT activation facilitates MYC-driven lymphomagenesis in mice, and it has been proposed that PI3K-AKT activation is essential for BL. Here we show that the PI3K-AKT activity in primary BLs and BL cell lines does not exceed that of human non-neoplastic tonsillar GC DZ B cells. BLs were not sensitive to AKT1 knockdown, which induced massive cell death in pAKThigh DLBCL cell lines. Likewise, BL cell lines show low sensitivity to pan-AKT inhibitors. Moreover, hyper-activation of the PI3K-AKT pathway by overexpression of a constitutively active version of AKT (myrAKT) or knockdown of PTEN repressed the growth of BL cell lines. This was associated with increased AKT phosphorylation, NF-κB activation, and downregulation of DZ genes including the proto-oncogene MYB and the DZ marker CXCR4. In contrast to GCB-DLBCL, PTEN overexpression was tolerated by BL cell lines. We conclude that the molecular mechanisms instrumental to guarantee the survival of normal DZ B cells, including the tight regulation of the PTEN-PI3K-AKT axis, also operate in the survival/proliferation of BL.


Conflict of interest statement

The authors declare that they have no conflict of interest.

Figures

Fig. 1
Fig. 1
Low PI3K-AKT activity in BL in comparison with GCB-DLBCL cell lines and tonsillar GC DZ B cells. a, b Expression and phosphorylation status AKT in BL and GCB-DLBCL cell lines was analysed by immunoblot. TUBB served as loading control. A representative of two independent experiments is shown. a Short exposure. b Long exposure. c Immunoblots of pAKTT308 and total AKT in three FACS-sorted tonsillar GC DZ B cells as well as two BL cell lines with lowest and highest pAKTT308 expression levels. d Expression and phosphorylation status of AKT in FACS-sorted tonsillar GC DZ B cells (sample #2 as shown in c) compared with BL and GCB-DLBCL cell lines with lowest and highest pAKTT308 levels was analysed by immunoblot
Fig. 2
Fig. 2
Physiological PI3K-AKT activation in BL. a Immunohistochemical detection of pAKTT308. Normal tonsillar GC B cells (GC) are weakly positive (+) while follicular mantle B cells (MZ) are strongly positive (+++). In BL pAKTT308 was weakly positive in most cases. The majority of GCB-DLBCL was clearly positive (++). Left column: Overview. Scale bar represents 200 µm. Right column: Details. Scale bar represents 100 µm. b Table gives details of all cases examined
Fig. 3
Fig. 3
BL cell lines are less sensitive to AKT1 knockdown than pAKThigh GCB-DLBCL cell lines. BL and GCB-DLBCL cell lines were transduced with vectors expressing AKT1 shRNA (A1sh) vs. scrambled (scr) control. a Knockdown efficiencies of AKT1sh vs. scr control. Transduced cells were FACS-sorted 5 days post transduction and total AKT expression was analysed. AKT expression was quantified using ImageJ software. A representative of two independent experiments is shown. b Cells were FACS-sorted 4 days post transduction, followed by cell counting using a cell viability analyser. Initial number of cells was set as 1. Data are shown as mean ± SD (N = 3). c Cell death analysis of cells expressing A1sh or scr. Transduced cells were sorted 4 days post transduction, and incubated in complete medium for 6 days followed by Annexin V-FITC/PI staining. Specific Apoptosis (SA) was calculated as SA (%) = 100 × (AE − AC)/(100 − AC), where AE equals the percentage of apoptotic cells in the experimental group and AC equals the percentage of apoptotic cells in the control group. Data are shown as mean ± SD (N = 3). The data were analysed by two-sided T-test. ****P < 0.0001. d Representative dot-plot images as shown in c
Fig. 4
Fig. 4
Low sensitivity of BL cell lines to AKT inhibitors. a Sensitivity of BL and GCB-DLBCL cell lines to AZD5363 (AZD). Cells were exposed to various concentrations of AZD for 5 days. Cell viability was assessed using MTT assay and IC50 values were calculated using GraphPad Prism software. Data are shown as mean ± SD (N = 3). b Percentage of viable BL or GCB-DLBCL cells 5 days post treatment with AZD5363. Cells were counted using a cell viability analyser. Initial number of cells was set as 100%. Data are shown as mean ± SD (N = 3). c Sensitivity of BLs with reported t(8;14) MYC translocations, not otherwise specified GCB-DLBCL, and AKThigh GCB-DLBCL cell lines to MK-2206 or GSK690693. IC50 values were obtained from cancerrxgene.org and analysed using Mann–Whitney U test with help of Social Science Statistics Calculator (socscistatistics.com). MK-2206: BL vs. total GCB-DLBCL **p = 0.004. BL vs. pAKThigh GCB-DLBCL **p = 0.001. GSK690693: BL vs. total GCB-DLBCL ns, p = 0.060. BL vs. pAKThigh GCB-DLBCL **p = 0.009. Maximum screening concentration: MK-2206 = 4 μM; GSK690693 = 10.2 μM
Fig. 5
Fig. 5
myrAKT overexpression is toxic for BL cell lines. af BL cell lines were transduced with lentiviral plasmids expressing constitutively active myrAKT or empty vector (EV). a Transduced cells were FACS-sorted 4 days post transduction and analysed for expression of total AKT and FOXO1 and pAKTT308 and pFOXO1T24 levels. TUBB served as loading control. A representative of two independent experiments is shown. b Percentage of transduced cells was measured every 3 days using flow cytometry. First measurement was performed 4 days post transduction and the percentage of GFP+ cells was set as 100. Data are shown as mean ± SD (N ≥ 3). c myrAKT downregulates CXCR4. BL cell lines expressing myrAKT or EV were stained with CXCR4-APC or isotype control 5–7 days post transduction. Dot-plots show percentages of CXCR4+/GFP+ and CXCR4/GFP+ cells. For histograms, only transduced GFP+ cells were included. Data are shown as mean ± SD (N = 3). d Downregulation of critical GC genes after myrAKT overexpression. Transduced cells were sorted 3 days post transduction and RNA expression levels were analysed by qRT-PCR. qRT-PCR data were quantified by the 2−ΔΔCT method. Data are shown as mean ± SD (N = 3). The data were analysed by two-sided T-test. For all genes and cell lines p < 0.05 with exception of BL-41 RAD51AP1 p = 0.135. e MYB expression in sorted GFP+ cells was analysed by immunoblot 3 days post transduction with myrAKT or EV. TUBB served as loading control. A representative of two independent experiments is shown. f myrAKT activates NF-κB. BL cell lines expressing myrAKT or EV were FACS-sorted 3 days post transduction and pRELAS536 and total RELA were analysed by immunoblot. TUBB served as loading control. A representative of two independent experiments is shown. g Luciferase reporter assay. Namalwa cells stably expressing a NF-κB-dependent luciferase reporter (3 × κB.luc) [60] were transduced with a vector expressing myrAKT. GFP+ cells were sorted 4 days post transduction. Luminescence was measured as described in Supplementary Methods. Data are shown as mean ± SD (N = 3)
Fig. 6
Fig. 6
PTEN expression is essential for BL cell lines. a Expression of PTEN in BL was analysed by immunoblot. GCB-DLBCL cell lines were included as controls. A representative of two independent experiments is shown. bh BL cell lines and/or GCB-DLBCL cell lines were transduced with vectors expressing PTEN shRNAs (PTsh#1, PTsh#2) or scr control. b Knockdown efficiencies of PTsh vs. scr control in BL cell lines and PTEN-positive GCB-DLBCL cell line OCI-Ly19. Transduced cells were selected using 4 µg/mL puromycin or FACS-sorted and PTEN expression was analysed. A representative of two or three independent experiments is shown. c Growth dynamics of transduced BL and GCB-DLBCL cell lines. The percentage of RFP+ cells was measured every 3 days using flow cytometry. First measurement was performed 4 days post transduction and the percentage of RFP+ cells was set as 100. Data are shown as mean ± SD (N ≥ 3). d Transduced cells were FACS-sorted 4–5 days post transduction and PTEN and pAKTT308 levels were analysed using immunoblot. A representative of two independent experiments is shown. e MYB expression levels in transduced and FACS-sorted BL cell lines expressing PTsh#2 or scr control were analysed by immunoblot 3 days post transduction. A representative of two independent experiments is shown. f BL cell lines expressing PTsh#2 or scr control were FACS-sorted 4 days post transduction and pRELAS536 and total RELA were analysed by immunoblot. TUBB served as loading control. A representative of two independent experiments is shown. g PTsh#2 downregulates CXCR4. BL cell lines expressing PTsh#2 or scr control were stained with CXCR4-APC or isotype control 4–7 days post transduction. Dot-plots show percentages of CXCR4+/RFP+ and CXCR4/RFP+ cells. For histograms, only transduced RFP+ cells were included. Data are shown as mean ± SD (N = 3). h AZD5363 (AZD) treatment partially rescues BL cell lines from the growth inhibitory effect of PTEN knockdown. BL cell lines were treated with 1 µM AZD 4–5 days post transduction with PTsh#2 and the percentage of RFP+ cells was measured every 3 days using flow cytometry. The percentage of RFP+ cells at first measurement was set as 100. Data are shown as mean ± SD (N = 3)
Fig. 7
Fig. 7
PTEN overexpression induces growth inhibition in GCB-DLBCL but not BL cell lines. ac BL and GCB-DLBCL cell lines were transduced with vectors expressing PTEN vs. empty vector (EV) control. a Transduction efficiencies were ranging from 11% to 100%. Transduced cells were lysed 4–5 days post transduction and PTEN overexpression was confirmed by immunoblot. GAPDH served as loading control. A representative of two independent experiments is shown. b Transduced cells were FACS sorted 4 days post transduction and analysed for expression of PTEN, FOXO1, pAKTT308, and pFOXOT24. TUBB served as loading control. A representative of two independent experiments is shown. c Growth dynamics of transduced BL and GCB-DLBCL cell lines. The percentage of GFP+ cells was measured every 3 days using flow cytometry. First measurement was performed 4–5 days post transduction and the percentage of GFP+ cells was set as 100. Data are shown as mean ± SD (N = 3). d Illustration of the maintenance of physiological mechanisms of PI3K-AKT regulation in BL. BLs maintain the original PI3K-AKT and IKK-NF-κB activation status to prevent extinguishing of the DZ programme, including CXCR4 and MYB. Part of the image is adapted from Motifolio Drawing Toolkits (www.motifolio.com)

Similar articles

Cited by

References

    1. Schmitz R, Ceribelli M, Pittaluga S, Wright G, Staudt LM. Oncogenic mechanisms in Burkitt lymphoma. Cold Spring Harb Perspect Med. 2014;4:pii: a014282. doi: 10.1101/cshperspect.a014282. - DOI - PMC - PubMed
    1. Kretzmer H, Bernhart SH, Wang W, Haake A, Weniger MA, Bergmann AK, et al. DNA methylome analysis in Burkitt and follicular lymphomas identifies differentially methylated regions linked to somatic mutation and transcriptional control. Nat Genet. 2015;47:1316–25. doi: 10.1038/ng.3413. - DOI - PMC - PubMed
    1. Swerdlow SH, Campo E, Pileri SA, Harris NL, Stein H, Siebert R, et al. The 2016 revision of the World Health Organization classification of lymphoid neoplasms. Blood. 2016;127:2375–90. doi: 10.1182/blood-2016-01-643569. - DOI - PMC - PubMed
    1. De Silva NS, Klein U. Dynamics of B cells in germinal centres. Nat Rev Immunol. 2015;15:137–48. doi: 10.1038/nri3804. - DOI - PMC - PubMed
    1. Dominguez-Sola D, Kung J, Holmes AB, Wells VA, Mo T, Basso K, et al. The FOXO1 transcription factor instructs the germinal center dark zone program. Immunity. 2015;43:1064–74. doi: 10.1016/j.immuni.2015.10.015. - DOI - PubMed

Publication types