. 2019 Nov 8:13:50.
doi: 10.1186/s13031-019-0234-9. eCollection 2019.

Beyond mapping: a case for geospatial analytics in humanitarian health

Affiliations

Beyond mapping: a case for geospatial analytics in humanitarian health

P Gregg Greenough et al. Confl Health. .

Abstract

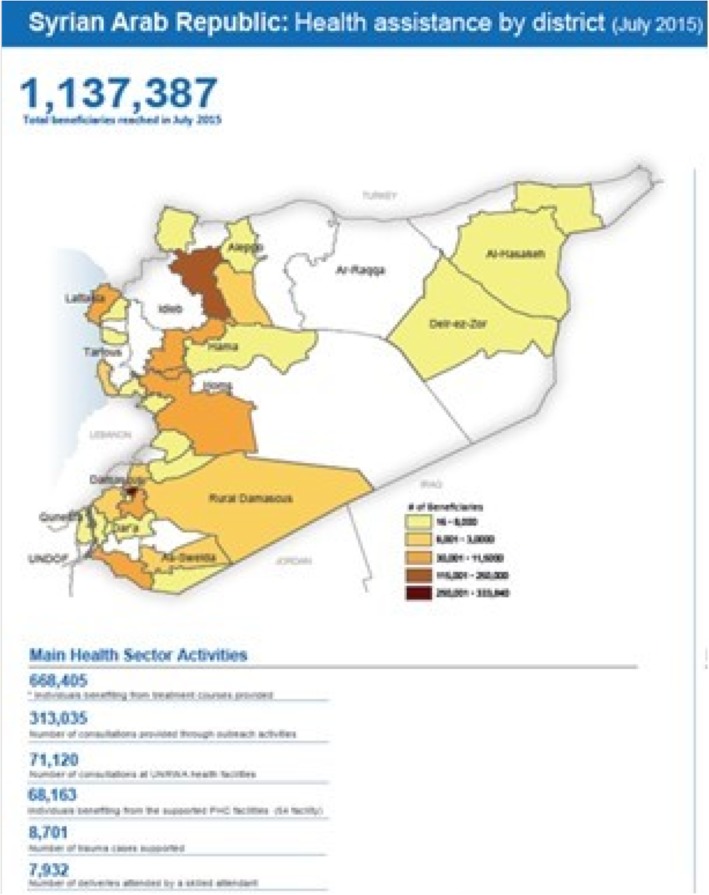
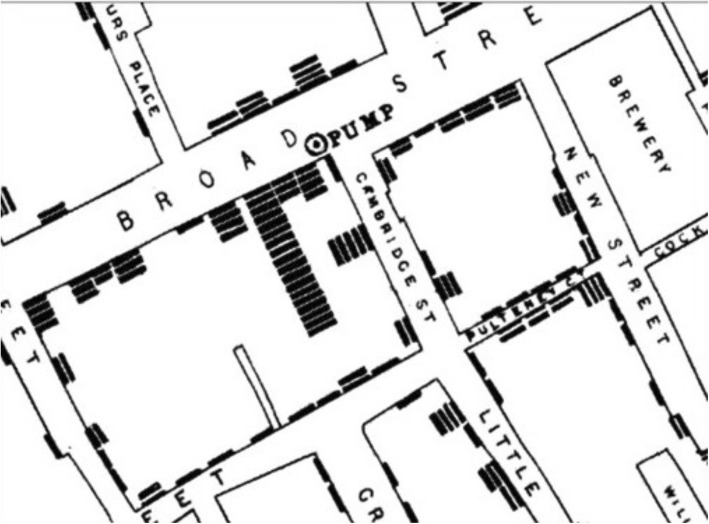
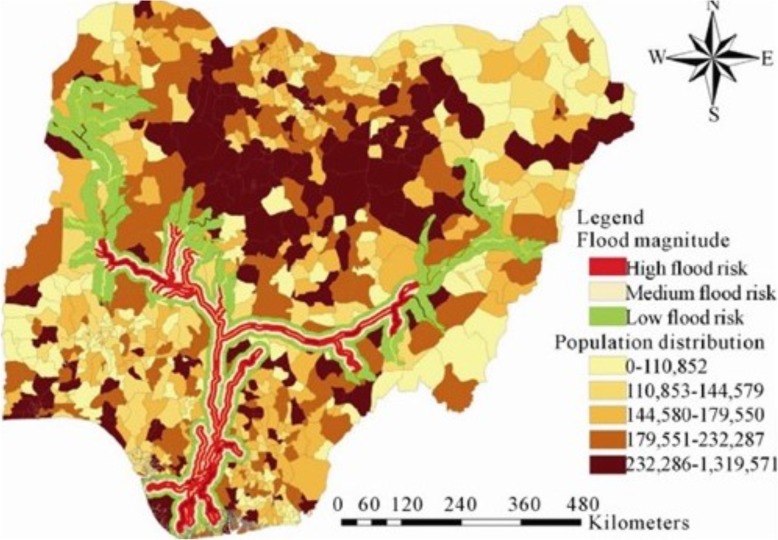
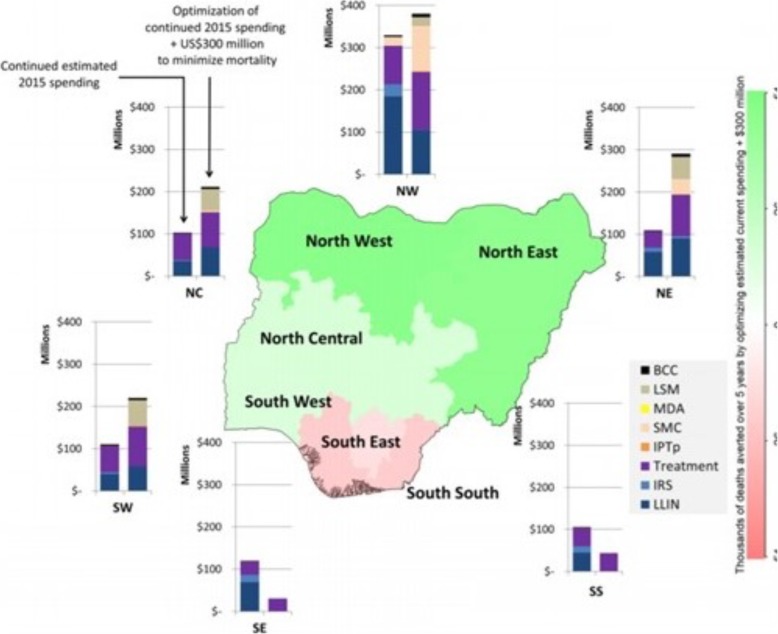
The humanitarian sector is increasingly adopting geospatial data to support operations. However, the utilization of these data in the humanitarian health arena is predominantly in thematic map format, thereby limiting the full insight and utility of geospatial information. Geospatial analytics, in contrast, including pattern analysis, interpolation, and predictive modeling, have tremendous potential within the field of humanitarian health. This paper explores a variety of historical and contemporary geospatial applications in the public health and humanitarian fields and argues for greater integration of geospatial analysis into humanitarian health research and programming. From remote sensing to create sampling frames, to spatial interpolation for environmental exposure analysis, and multi-objective optimization algorithms for humanitarian logistics, spatial analysis has transformed epistemological paradigms, research methods and programming landscapes across diverse disciplines. The field of humanitarian health, which is inextricably bounded by geography and resource limitations, should leverage the unique capacities of spatial methods and strategically integrate geospatial analytics into research and programming not only to fortify the academic legitimacy and professionalization of the field but also to improve operational efficiency and mitigation strategies.

Keywords: GIS; Geographic information systems; Geospatial analysis; Humanitarian health; Spatial analysis.


Conflict of interest statement

Competing interestsEN has no conflict of or competing interests. PGG is a standing member of the Conflict and Health Editorial Board. Understandably, he will not be a reviewer of this article, and agrees that decisions regarding the submission and publication of this article will not influence his work on the editorial board. Otherwise, PG has no financial or non-financial competing interests.

Figures

Fig. 1
Fig. 1
Contemporaneous thematic map of food security, FEWS-Net. The Famine Early Warning Systems Network coalesces prospective food security data in a mapped format to indicate geographic areas of acute food insecurity by degree of severity. Used unedited with permission from the Famine Early Warning Network
Fig. 2
Fig. 2
OCHA-generated health sector operations map within Syria. The choropleth map shows the density of beneficiaries in relationship to health sector activities. Used unedited with permission of the UN Office for the Coordination of Humanitarian Affairs
Fig. 3
Fig. 3
UNOSAT-generated Thailand-Malaysia border flood situational report for OCHA’s humanitarian information unit. This remotely sensed image analysis map product from two satellite images taken 11 December 2016 and 4 January 2017 shows color-enhanced areas of increasing flood zones in relation to human settlement areas. Used unedited with permission of the UN Office for the Coordination of Humanitarian Affairs
Fig. 4
Fig. 4
Map of the 1854 Cholera outbreak in relation to the water supply. John Snow’s mapping of cholera cases demonstrates the spatial approach to the science of public health, the dispersion and clustering of cases and their relationship to a causative agent. Terms of use: this work is licensed under a Creative Commons Attribution Generic License. It is attributed to John Snow and the original work can be found here, https://www.ncbi.nlm.nih.gov/pmc/articles/PMC2250686/pdf/brmedj06236-0004.pdf
Fig. 5
Fig. 5
Spatial analysis of percentage of people who remained away from home, 4 months after the 2015 Nepalese earthquake. The map depicts call detail records at the sub-district or village development committee level (VDR) as a percentage of the population that remain displaced from their VDC of cell phone record 4 months after the earthquake. Terms of use: this work is licensed under Creative Commons Attribution License and used unedited. Attributed to Wilson, et al. PLoS Curr Dis, 2016; original version at: http://currents.plos.org/disasters/index.html%3Fp=27109.html
Fig. 6
Fig. 6
a (top). First stage of a population-based cluster sample using ArcGIS and LandScan, a gridded population dataset, Galway, et al. The main image frame (top) shows a LandScan (Oak Ridge National Laboratory) satellite image of Iraq with population density by square kilometer. The inset to the right amplifies these pixels of population density highlighting the more densely urbanized area of Baghdad. For sampling purposes, a population researcher can randomly select areas based on population dispersion. b (bottom). Second stage of sampling using ArcGIS grids on Google Earth kml files, Galway, et al. At the household sampling level, superimposed grids are randomly sampled using Google Earth imagery. Terms of use for both figures: this work is licensed under Creative Commons Attribution License 4.0 and used unedited. Attributed to Galway, et al., Intl J Health Geogr, 2012; original version at: https://ijhealthgeographics.biomedcentral.com/articles/10.1186/1476-072X-11-12
Fig. 7
Fig. 7
An example of hazard risk analysis: spatial distribution of population at risk to flood along the Niger-Benue river system, Nigeria. Multiple data layers of environmental features and historical flood zones are combined with population layers to synthesize flood risk for vulnerable populations. Terms of use: this work is licensed under Creative Commons Attribution License 4.0 and used unedited. Attributed to Nkeki, et al., JGIS, 2013; original version at: https://file.scirp.org/Html/3-8401214_29778.htm
Fig. 8
Fig. 8
Geospatial optimization to minimize malaria mortality. Here a geospatial analysis of spending in health care for a range of malaria prevention and management in regions of Nigeria in 2015 can be modeled to estimate the number of deaths averted with additional funding. Terms of use: this work is licensed under Creative Commons Attribution License 4.0 and used unedited. Attributed to Scott, et al., Malar J, 2017; original version at: https://malariajournal.biomedcentral.com/articles/10.1186/s12936-017-2019-1
Fig. 9
Fig. 9
Cluster analysis of condom use in circumcised men at risk for HIV. Here, mapping program outcomes of an HIV prevention program (condom use) provides a basis for cluster analysis to better understand the reasons for success or failure of a health program. Used unedited by permission of the MEASURE Evaluation, University of North Carolina, Chapel Hill. Attributed to Moise, et al., 2015. Original version at: https://www.measureevaluation.org/resources/publications/ms-14-98

References

    1. FEWS-NET website. http://www.fews.net/about-us. Accessed 19 Nov 2018.
    1. Physicians for Human Rights website. A map of attacks on health care in Syria. http://physiciansforhumanrights.org/library/multimedia/a-map-of-attacks-.... Accessed 18 Apr 2017.
    1. Clark L. How spatial analytics is helping hunt the LRA and al-Shabaab. Wired website. 2013.
    1. Congram D, Kenyhercz M, Green AG. Grave mapping in support of the search for missing persons in conflict contexts. Forensic Sci Int. 2017;278:260–268. doi: 10.1016/j.forsciint.2017.07.021. - DOI - PubMed
    1. Schultz C, Alegría AC, Cornelis J, Sahli H. Comparison of spatial and aspatial logistic regression models for landmine risk mapping. Appl Geogr. 2016;66:52–63. doi: 10.1016/j.apgeog.2015.11.005. - DOI

LinkOut - more resources