. 2017 May 3;10(4):313-325.
doi: 10.1007/s12195-017-0488-5. eCollection 2017 Aug.

Oxidative Stress Alters the Morphological Responses of Myoblasts to Single-Site Membrane Photoporation

Affiliations

Oxidative Stress Alters the Morphological Responses of Myoblasts to Single-Site Membrane Photoporation

Xinxing Duan et al. Cell Mol Bioeng. .

Abstract

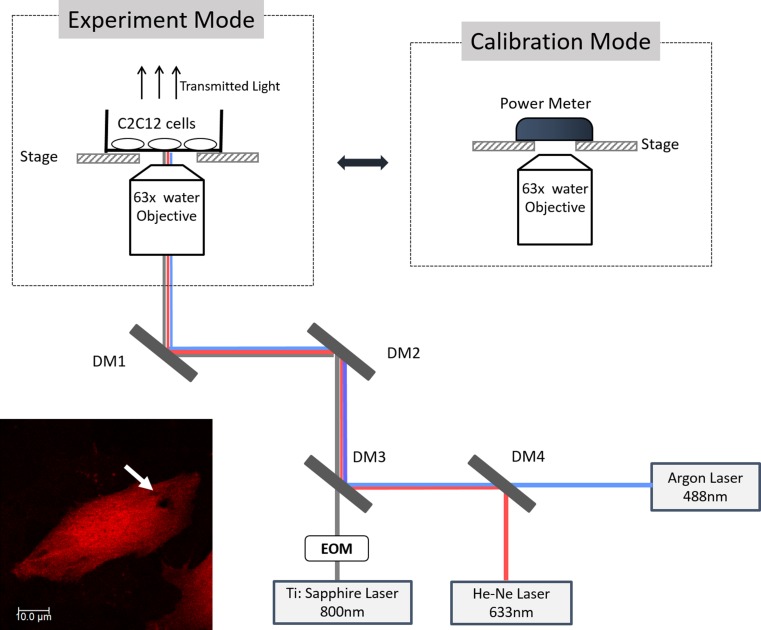
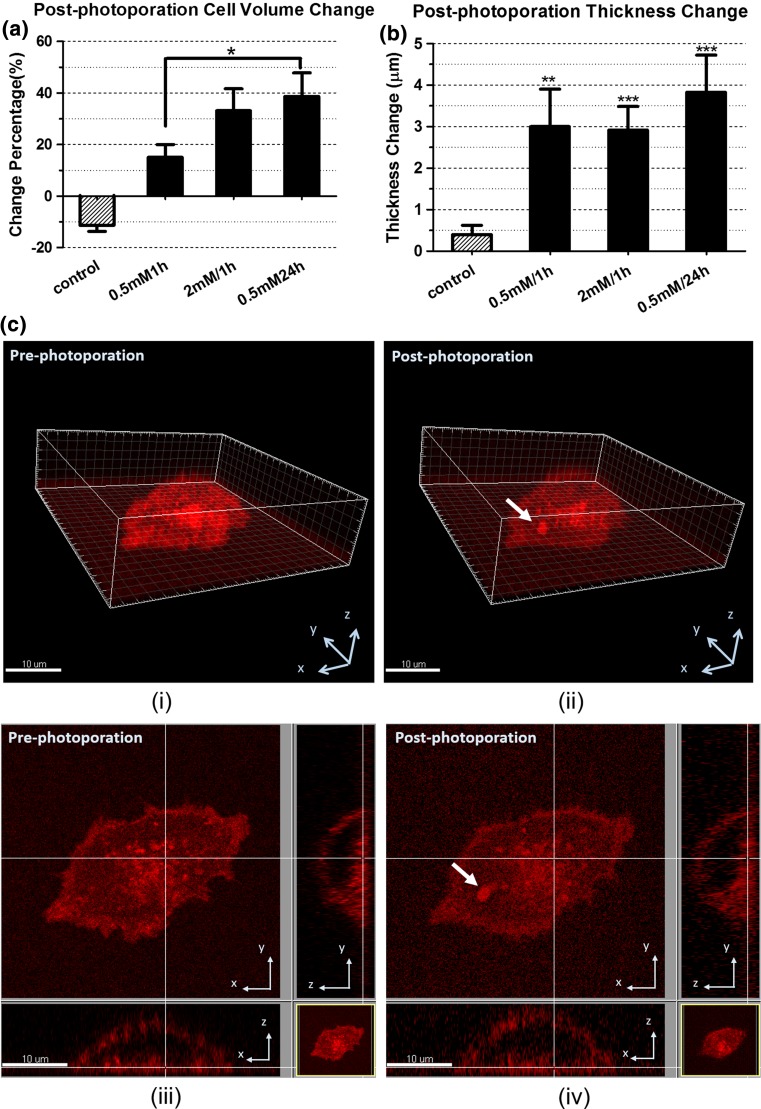
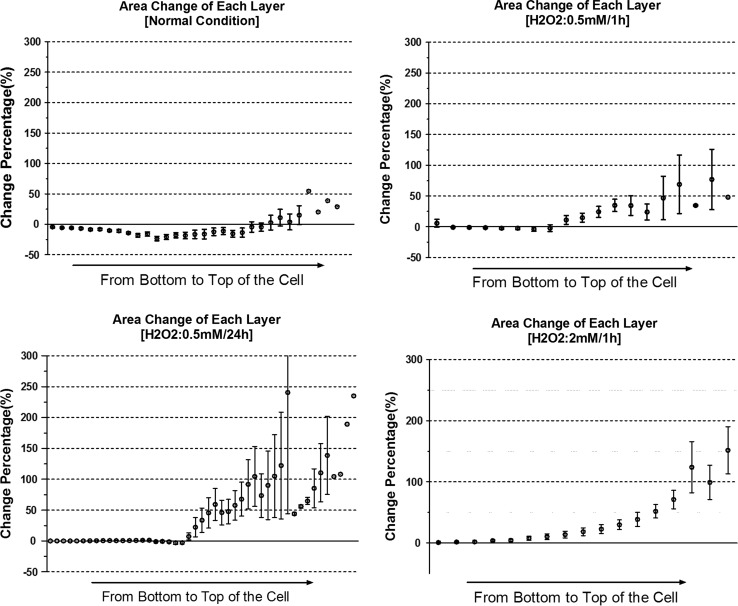
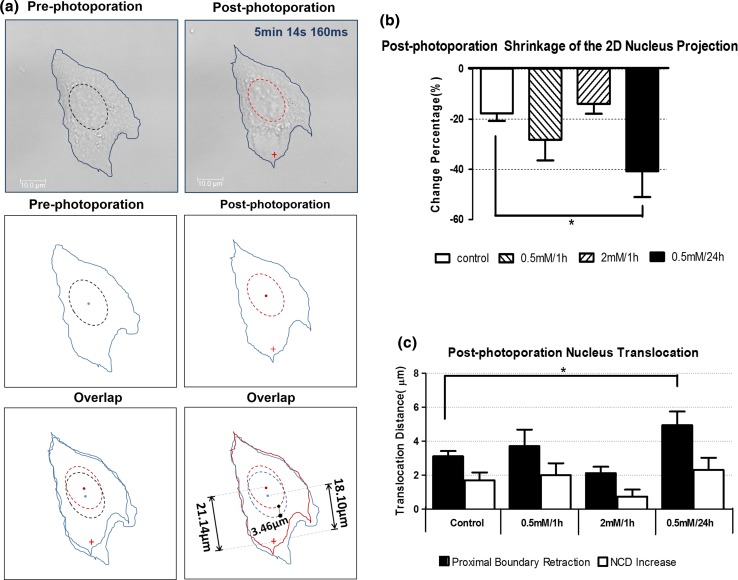
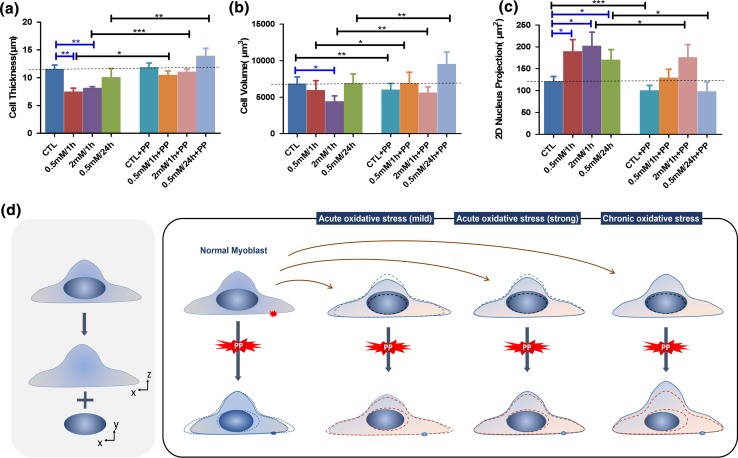
The responses of single cells to plasma membrane damage is critical to cell survival under adverse conditions and to many transfection protocols in genetic engineering. While the post-damage molecular responses have been much studied, the holistic morphological changes of damaged cells have received less attention. Here we document the post-damage morphological changes of the C2C12 myoblast cell bodies and nuclei after femtosecond laser photoporation targeted at the plasma membrane. One adverse environmental condition, namely oxidative stress, was also studied to investigate whether external environmental threats could affect the cellular responses to plasma membrane damage. The 3D characteristics data showed that in normal conditions, the cell bodies underwent significant shrinkage after single-site laser photoporation on the plasma membrane. However for the cells bearing hydrogen peroxide oxidative stress beforehand, the cell bodies showed significant swelling after laser photoporation. The post-damage morphological changes of single cells were more obvious after chronic oxidative exposure than that after acute ones. Interestingly, in both conditions, the 2D projection of nucleus apparently shrank after laser photoporation and distanced itself from the damage site. Our results suggest that the cells may experience significant multi-dimensional biophysical changes after single-site plasma membrane damage. These post-damage responses could be dramatically affected by oxidative stress.

Keywords: Cell morphology; Femtosecond laser photoporation; Oxidative stress; Plasma membrane damage; Single cell wound response.


Figures

Figure 1
Figure 1
The schematic of the experimental platform. In the laser calibration mode, a power meter was placed on the stage to measure the fs laser power. During the experiment, C2C12 sample dish was placed on the stage. DM denotes dichroic mirror; EOM denotes Electro-Optic Modulator. One photoporated cell sample is shown at the bottom left corner. The fs laser induced pore is highlighted by white arrows. The criteria for the site of laser irradiation included: (a) on the basal plasma membrane; (b) generally along the long axis of the cell; (c) preferentially on the side with a larger membrane area; and (d) roughly at the midpoint between the cell boundary and the nucleus envelope.
Figure 2
Figure 2
The post-photoporation morphological changes of the cells in the four groups. (a) change of cell volume; (b) change of cell thickness; (c) 3D image reconstruction of a myoblast pre-treated by 0.5 mM H2O2 for 1 h. (i) before photoporation and (ii) ~5 min after photoporation. (iii) and (iv) are the bottom cross-section of (i) and (ii) respectively. Bar = 10 µm. The arrows denotes the photoporation site. Quantification was based on 6 to 10 myoblasts from 3 to 4 independent experiments. (*:p < 0.05; **:p < 0.01; ***:p < 0.001)
Figure 3
Figure 3
Comparison of the post-photoporation area change in each cross-sectional layer of single myoblasts in different groups. The error bar represents the SEM of the percentage changes at the same height of different cells, i.e. the same distance between the layer and the cell bottom. The isolated data points without error bar present the data of the higher layers belonging to the thickest cell. Quantification was based on the same myoblast samples in Fig. 2.
Figure 4
Figure 4
Nucleus transformation and translocation after laser photoporation. (a) The shift of the proximal boundary and NCD. The first row showed the comparison of pre-photoporation and post-photoporation bright field images. The blue lines portray the cell boundary. The dashed lines represent the nucleus-fitted ellipses. The redcross denotes the fs laser damage site. The second row delineated the sketches of the boundary of the nucleus and cell shape extracted from the bright field image. The third row was the overlay of the pre-photoporation and post-photoporation sketches. In the right sketch, the blue line portrays the pre-photoporation profile and the red line portrays the post-photoporation profile. The pre-photoporation NCD was 18.1 µm and the post-photoporation NCD was 21.1 µm. The proximal boundary translocation was 3.5 µm. (b) post-photoporation change in the 2D projected area of the nuclei in the four groups — only the 0.5 mM/24 h group showed a significant difference with the control group (*p < 0.05). (c) Retraction of the 2D proximal boundary of the nuclei and the NCD increase after photoporation. Control group: n = 10; 0.5 mM/1 h group: n = 7; 2 mM/1 h group: n = 6; 0.5 mM/24 h group: n = 6. Data were collected from 3 to 4 independent experiments.
Figure 5
Figure 5
The morphology characteristics of the cells under different conditions. (a) cell thickness; (b) cell volume; (c) 2D projected area of the nucleus. CTL represents the data from the freshly cultured cell sample without prior treatment. The left four columns of each graph display the data acquired before photoporation, while the right four column are the data after photoporation. PP denotes photoporation. Quantification was based on the same myoblast samples in Fig. 4. (*:p < 0.05; **:p < 0.01; ***:p < 0.001). (d) A schematic diagram of the morphological responses that illustrates how the different oxidative treatments and photoporation affected the morphology of cells and nuclei progressively. The blue lines portray the real-time morphology in each experimental step. Both the red and blue dashed lines represent the previous morphology in the last experimental step.

References

    1. Abreu-Blanco MT, Verboon JM, Parkhurst SM. Single cell wound repair: Dealing with life’s little traumas. Bioarchitecture. 2011;1(3):114–121. doi: 10.4161/bioa.1.3.17091. - DOI - PMC - PubMed
    1. McNeil PL, Ito S. Gastrointestinal cell plasma membrane wounding and resealing in vivo. Gastroenterology. 1989;96(5 Pt 1):1238–1248. doi: 10.1016/S0016-5085(89)80010-1. - DOI - PubMed
    1. Abreu-Blanco MT, Watts JJ, Verboon JM, Parkhurst SM. Cytoskeleton responses in wound repair. Cell. Mol. Life Sci. 2012;69(15):2469–2483. doi: 10.1007/s00018-012-0928-2. - DOI - PMC - PubMed
    1. McNeil PL, Vogel SS, Miyake K, Terasaki M. Patching plasma membrane disruptions with cytoplasmic membrane. J. Cell Sci. 2000;113(11):1891–1902. - PubMed
    1. Mandato CA, Bement WM. Contraction and polymerization cooperate to assemble and close actomyosin rings around Xenopus oocyte wounds. J. Cell Biol. 2001;154(4):785–798. doi: 10.1083/jcb.200103105. - DOI - PMC - PubMed

LinkOut - more resources