. 2019 Sep 24;12(5):511-528.
doi: 10.1007/s12195-019-00598-9. eCollection 2019 Oct.

Optogenetic Repressors of Gene Expression in Yeasts Using Light-Controlled Nuclear Localization

Affiliations

Optogenetic Repressors of Gene Expression in Yeasts Using Light-Controlled Nuclear Localization

Stephanie H Geller et al. Cell Mol Bioeng. .

Abstract

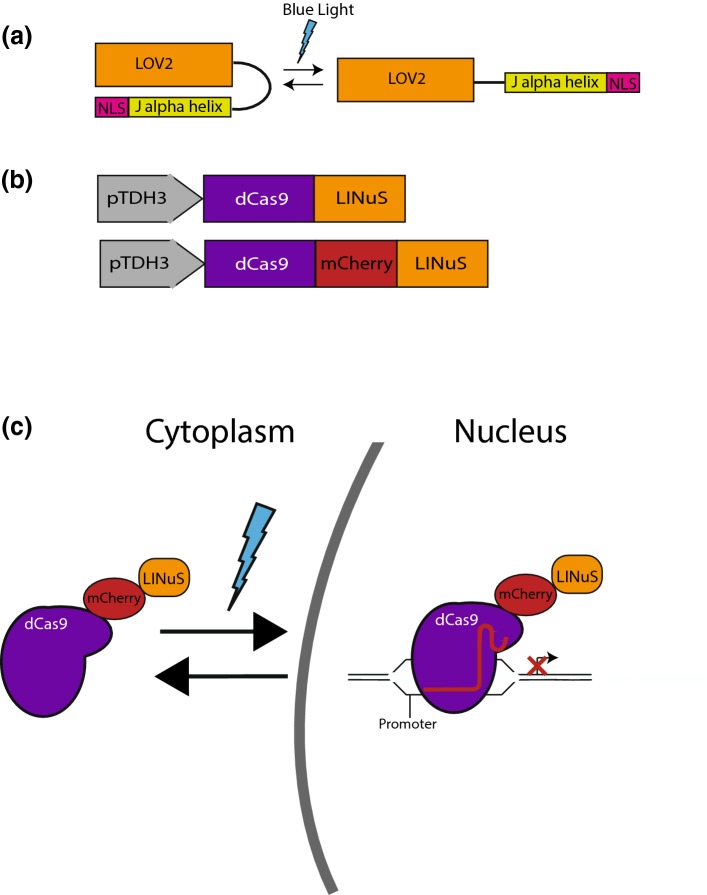
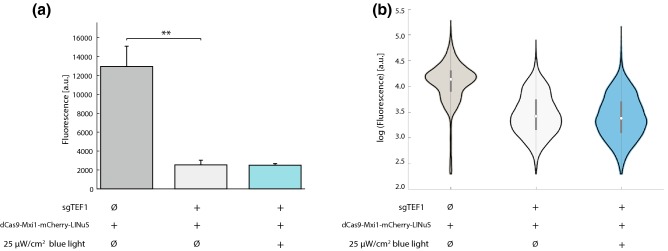
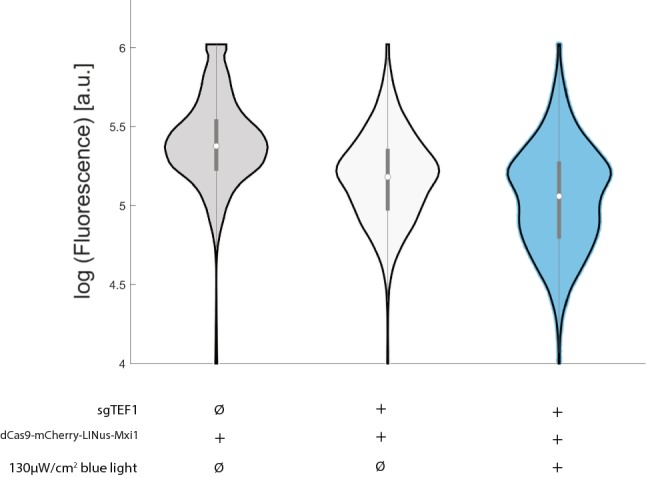
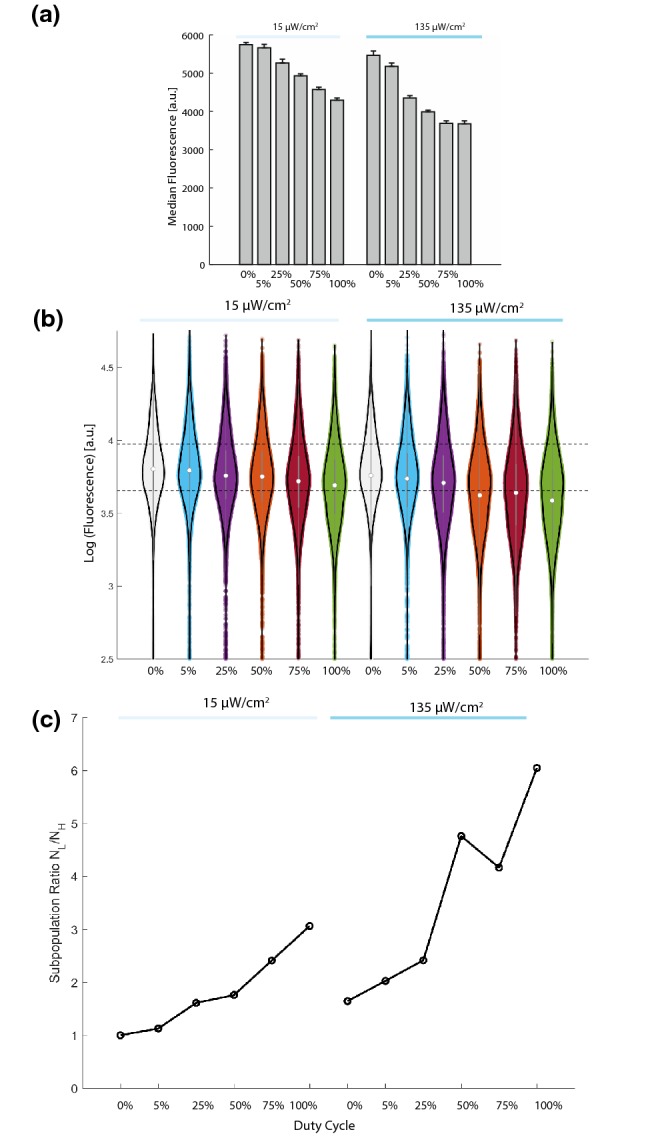
Introduction: Controlling gene expression is a fundamental goal of basic and synthetic biology because it allows insight into cellular function and control of cellular activity. We explored the possibility of generating an optogenetic repressor of gene expression in the model organism Saccharomyces cerevisiae by using light to control the nuclear localization of nuclease-dead Cas9, dCas9.

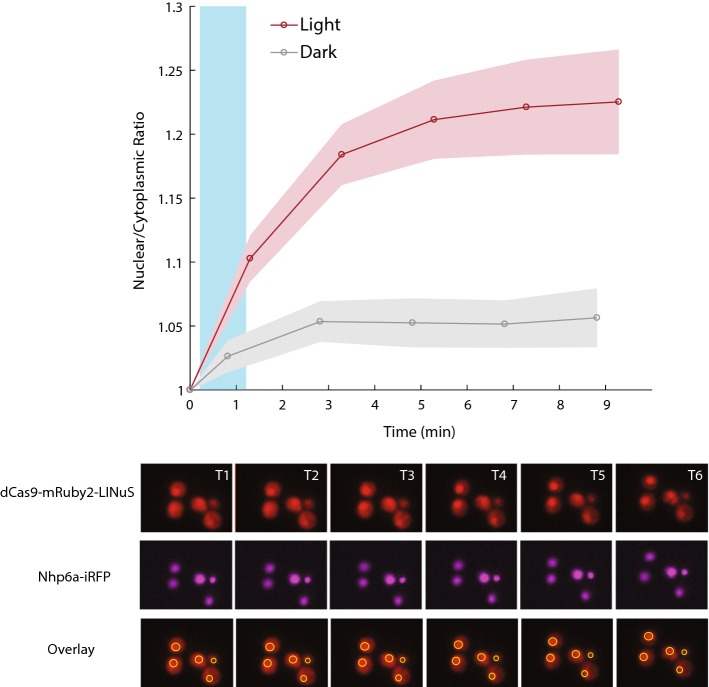
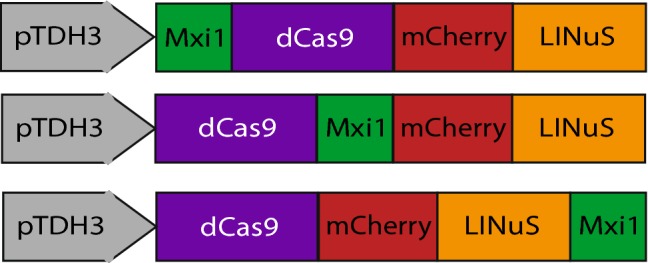
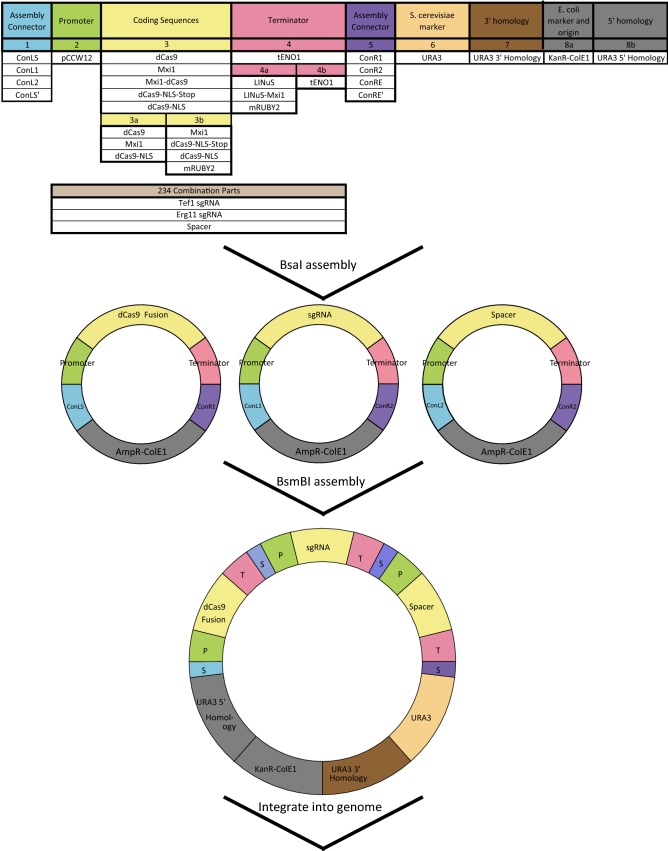
Methods: The dCas9 protein acts as a repressor for a gene of interest when localized to the nucleus in the presence of an appropriate guide RNA (sgRNA). We engineered dCas9, the mammalian transcriptional repressor Mxi1, and an optogenetic tool to control nuclear localization (LINuS) as parts in an existing yeast optogenetic toolkit. This allowed expression cassettes containing novel dCas9 repressor configurations and guide RNAs to be rapidly constructed and integrated into yeast.

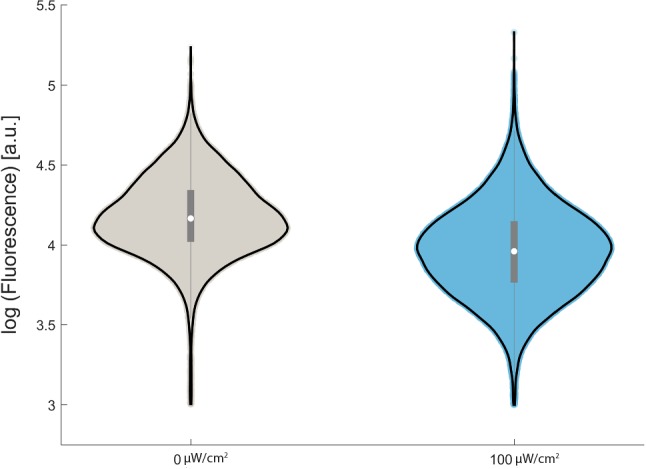
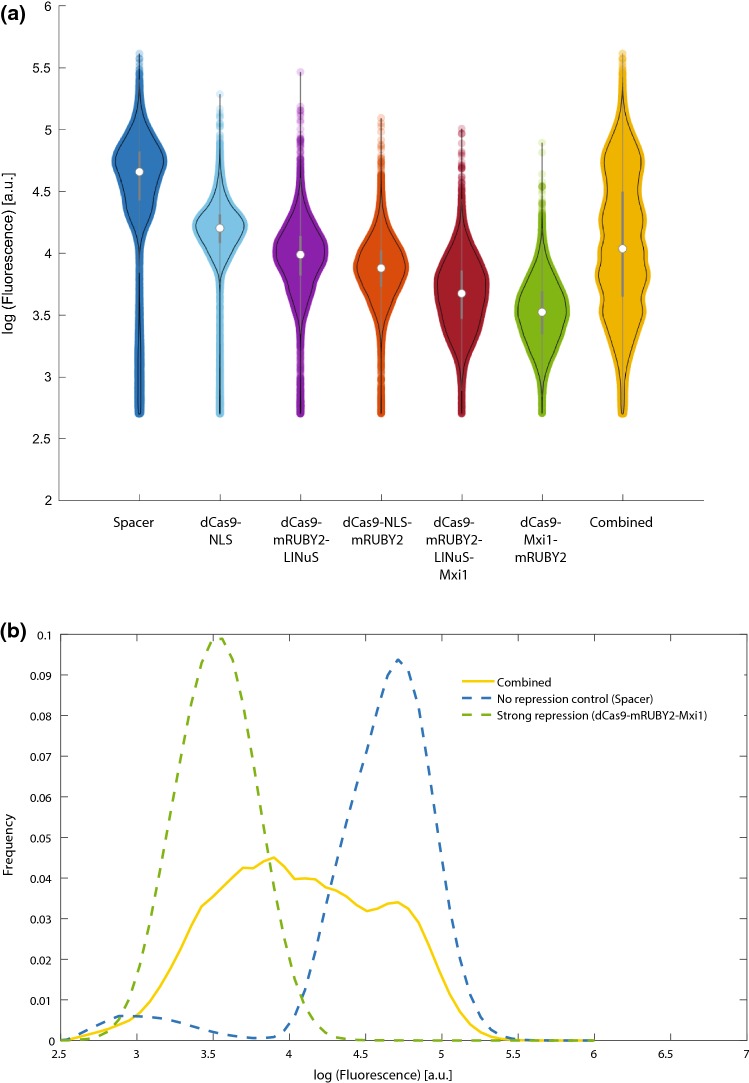
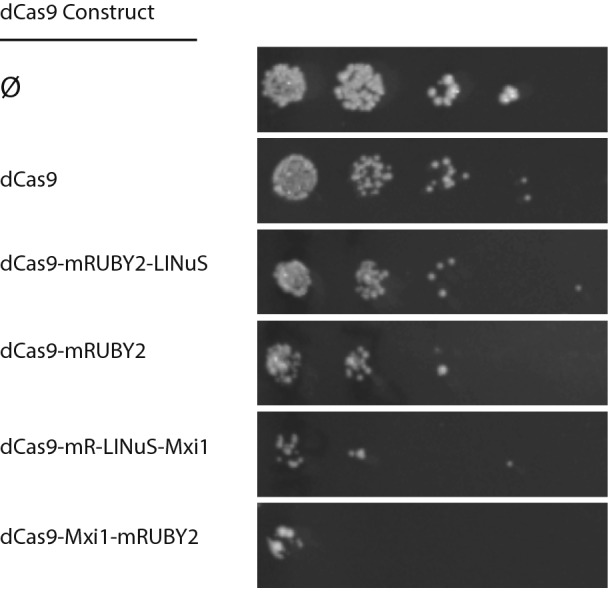
Results: Our library of repressors displays a range of basal repression without the need for inducers or promoter modification. Populations of cells containing these repressors can be combined to generate a heterogeneous population of yeast with a 100-fold expression range. We find that repression can be dialed modestly in a light dose- and intensity-dependent manner. We used this library to repress expression of the lanosterol 14-alpha-demethylase Erg11, generating yeast with a range of sensitivity to the important antifungal drug fluconazole.

Conclusions: This toolkit will be useful for spatiotemporal perturbation of gene expression in Saccharomyces cerevisiae. Additionally, we believe that the simplicity of our scheme will allow these repressors to be easily modified to control gene expression in medically relevant fungi, such as pathogenic yeasts.

Keywords: Fungal drug resistance; Gene expression; LINuS; Optogenetics; dCas9.


Figures

Figure 1
Figure 1
(a) In the dark state, the Jα helix in LINuS is folded and interacts with the AsLOV2 core domain. This sequesters the nuclear localization signal (NLS) and prevents it from interacting with importins. Upon blue light exposure, the Jα helix unfolds rendering the NLS accessible. (b) Schematic of the dCas9-LINuS and dCas9-mCherry-LINuS used in this study. pTDH3 is a constitutively strong promoter. (c) Blue light induces unfolding of the Jα helix, allowing endogenous importins to interact with the nuclear localization signal allowing dCas9-mCherry-LINuS to be imported into the nucleus where it sterically inhibits transcription by binding to promoters or coding regions as guided by the appropriate sgRNA.
Figure 2
Figure 2
Growth in 100 µW/cm2 blue light induces a significant 1.6-fold repression of Tef1-GFP expression from the TEF1 promoter (median population fluorescence, n = 3, p < 0.00005, Welch’s T test) relative to growth in the dark. Violin plots of Tef1-GFP fluorescence in representative populations indicate that there is significant overlap between gene expression in the blue light population and the dark population.
Figure 3
Figure 3
In response to stimulation with blue light, dCas9-mRuby2-LINuS localizes to the nucleus in Saccharomyces cerevisiae. Cells were stimulated with 1 W/cm2 blue light for 1 min (blue bar). Time points T1-T6 are 0, 1.3, 3.3, 5.3, 7.3, 9.3 min respectively. Localization is measured by comparing the nuclear mRuby2 signal (co-localized with Nhp6A-iRFP) to the cytoplasmic signal in individual cells (n = 108, 143 for light and dark respectively). Fold-change is measured relative to the T = 0 nuclear to cytoplasmic signal and error bars represent the 95% confidence interval.
Figure 4
Figure 4
In order to explore how the orientation of the Mxi1 repressor domain affected our ability to make a light-inducible repressor we made three fusion proteins with Mxi1 in different orientations: Mxi1-dCas9-mCherry-LINuS, dCas9-Mxi1-mCherry-LINuS and dCas9-mCherry-LINuS-Mxi1.
Figure 5
Figure 5
Yeast strains carrying dCas9-Mxi1-mCherry-LINuS with or without the sgTEF1 guide RNA were compared for repression in light and dark. (a) Co-transformation of dCas9-Mxi1-mCherry-LINuS with sgTEF1 leads to a 5-fold repression in median Tef1-GFP expression with or without light relative to the no guide control (median fluorescence, n = 3, p < 0.01, Welch’s t-test). (b) Violin plots demonstrate the increase in expression range in the dCas9-Mxi1-mCherry-LINuS + sgTEF1 strains with or without light relative to the control. Violin plots represent median, interquartile range, and 95% confidence interval on a representative population of cells (biological replicates).
Figure 6
Figure 6
Yeast strains carrying dCas9-mCherry-LINuS-Mxi1 with or without the sgTEF1 guide RNA were compared for repression in light and dark. Co-transformation of dCas9-mCherry-LINuS-Mxi1 with sgTEF1 led to basal repression (1.7 fold) in the dark but light was able to cause a significant moderate increase in repression (1.3 fold, n = 3, p < 0.0001, Welch’s t-test). Violin plots represent median, interquartile range, and 95% confidence interval on a representative population of cells with or without 130 µW/cm2 blue light.
Figure 7
Figure 7
Duty cycle increases repression and expression variability in strains carrying the dCas9-mCherry-LINuS repressor. (a) Strains carrying dCas9-mCherry-LINuS and the sgTEF1 guide RNA were exposed to cycles of 15 µW/cm2 or 135 µW/cm2 blue light at increasing duty cycle (0% off 5% 1 s on/19 s off, 25% 5 s on/15 s off, 50% 10 s on 10 s off 75% 15 s on 5 s off 100% on). Increasing duty cycle increases repression up to a maximum of 1.5-fold. Error bars represent 95% confidence intervals on the average of the median fluorescence from n = 3 biological replicates. (b) Duty cycle increases the population of low expressing cells while leaving a significant fraction of the population distributed through the wild-type (dark) expression levels. Dashed lines represent the first and third quartile for cells carrying dCas9-mCherry-LINuS/sgTEF1 in the dark. (c) Plotting the subpopulation ratio (NL/NH) shows that increasing light dosage increases the ratio of low expressors to high expressors in the population (up to 6-fold for dCas9-mCherry-LINuS-Mxi1).
Figure 8
Figure 8
Light intensity increases repression and expression variability in strains carrying the dCas9-mCherry-LINuS and dCas9-mCherry-LINuS-Mxi1 repressors. (a) Strains carrying dCas9-mCherry-LINuS or dCas9-mCherry-LINuS-Mxi1 and the sgTEF1 guide RNA were exposed to increasing light intensities. Increasing light intensity increases repression in both the dCas9-mCherry-LINuS repressor and the dCas9-mCherry-LINuS-Mxi repressor, consistent with previous results. Error bars represent 95% confidence intervals on the average of the median fluorescence from n = 3 biological replicates. (b) Light intensity increases the population of low expressing cells while leaving a significant fraction of the population distributed through the wild-type (dark) expression levels. Dashed lines represent the first and third quartile for cells carrying dCas9-mCherry-LINuS/sgTEF1 in the dark. The most variable population is dCas9-mCherry-LINuS-Mxi1 at 100 µW/cm2. This population has significant overlap with both the dark population as well as the constitutively repressed (dCas9/sgTEF1) population. Controls (dCas9 +sgTEF1, dark grey) and dCas9-Mxi1 +sgTEF1, light grey) are shown for comparison. (c) Plotting the subpopulation ratio (NL/NH) shows that increasing light intensity increases the ratio of low expressors to high expressors in the population (up to 10-fold for dCas9-mCherry-LINuS-Mxi1). The controls (dCas9, dCasi-Mx1) change the subpopulation ratio (NL/NR) 450- and 1500-fold respectively and are therefore not shown on this plot.
Figure 9
Figure 9
We generated dCas9, LINuS, and Mxi1 as either coding sequence or terminator parts, with and without stop codons and constitutive NLSs to allow for versatile repressors to be constructed using the toolkit. Part plasmids contain unique upstream and downstream BsaI-generated overhangs to assemble into the appropriate position in “Cassette” plasmids. Cassette plasmids are fully functional transcriptional units that are further assembled into multigene plasmids using BsmBI assembly and appropriate Assembly Connectors. This figure utilizes the color scheme and organization from Lee et al. and An-Adirrekun et al. to illustrate how the new optogenetic components integrate with the existing yeast toolkit. (P, Promoter; T, Terminator; S, Scar)
Figure 10
Figure 10
(a) Basal (dark) repression of Tef1-GFP varies in the different repressor configurations. Each violin plot represents median, interquartile range, and 95% confidence interval on a representative population of cells (three biological replicates). (b) By randomly combining cells from each population, we can in silico generate a population of cells with expression varying over a 100-fold range, from the highest values to the most repressed (dCas9-Mxi1-mRuby2) values (“Combined”).
Figure 11
Figure 11
Repressors in Fig. 10 were assembled into multigene cassettes containing a guide RNA for the ERG11 gene. Repression of ERG11 confers sensitivity to the antifungal drug fluconazole. Dilutions (1:1, 1:10, 1:100, 1:1000 left to right) of cells were spotted onto plates containing 32 mg/mL fluconazole and grown in ambient light. The strain without a repressor shows no additional fluconazole sensitivity relative to wild-type cells. Sensitivity in strains carrying the dCas9 repressors agrees qualitatively with the repression of Tef1-GFP seen in Fig. 10a.

References

    1. Anadirekkun J, Stewart C, Geller S, Patel M, Melendez J, Oakes B, Noyes M, McClean M. A yeast optogenetic toolkit (yOTK) for gene expression control in Saccharomyces cerevisiae. BioRxiv. 2019 doi: 10.1101/663393. - DOI - PMC - PubMed
    1. Aubrey B, Kelly G, Brennan KAM, O’Connor L, Milla L, Wilcox S, Tai L, Strasser A, Herold M. An inducible lentiviral guide RNA platform enables the identification of tumor-essential genes and tumor-promoting mutations in vivo. Cell Reports. 2015;10:1422–1432. doi: 10.1016/j.celrep.2015.02.002. - DOI - PubMed
    1. Bódi Z, Farkas Z, Nevozhay D, Kalapis D, Lázár V, Csörgö B, Nyerges Á, Szamecz B, Fekete G, Papp B, Araújo H, Oliveira J, Moura G, Santos M, Székely T, Jr, Balázsi G, Pál C. Phenotypic heterogeneity promotes adaptive evolution. PLOS Biology. 2017;15(5):e2000644. doi: 10.1371/journal.pbio.2000644. - DOI - PMC - PubMed
    1. Brachmann C, Davies A, Cost G, Caputo E, Li J, Heiter P, Boeke J. Designer deletion strains derived from Saccharomyces cerevisiae S288C: a useful set of strains and plasmids for PCR-mediated gene disruption and other applications. Yeast. 1998;14:115–132. doi: 10.1002/(SICI)1097-0061(19980130)14:2<115::AID-YEA204>3.0.CO;2-2. - DOI - PubMed
    1. Branch M, Coleman T, Li Y. A Subspace, Interior, and Conjugate Gradient Method for Large-Scale Bound-Constrained Minimization Problems. SIAM Journal of Scientific Computing. 1999;21(1):1–23. doi: 10.1137/S1064827595289108. - DOI

LinkOut - more resources