

Utility of a Reverse Phase Protein Array to Evaluate Multiple Biomarkers in Diffuse Large B-Cell Lymphoma
- PMID: 31721454
- PMCID: PMC7003765
- DOI: 10.1002/prca.201900091
Utility of a Reverse Phase Protein Array to Evaluate Multiple Biomarkers in Diffuse Large B-Cell Lymphoma
Abstract
Purpose: Diffuse large B-cell lymphoma (DLBCL), the most common non-Hodgkin lymphoma, is a heterogeneous lymphoma with different clinical manifestations and molecular alterations, and several markers are currently being measured routinely for its diagnosis, subtyping, or prognostication by immunohistochemistry (IHC). Here, the utility of a reverse-phase-protein-array (RPPA) as a novel supportive tool to measure multiple biomarkers for DLBCL diagnosis is validated.
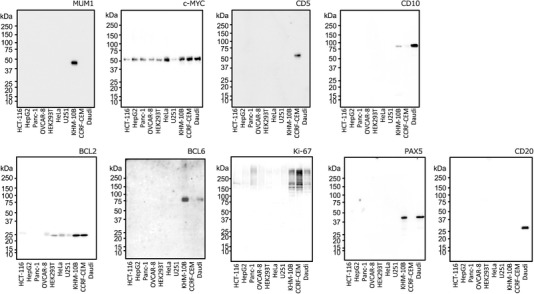
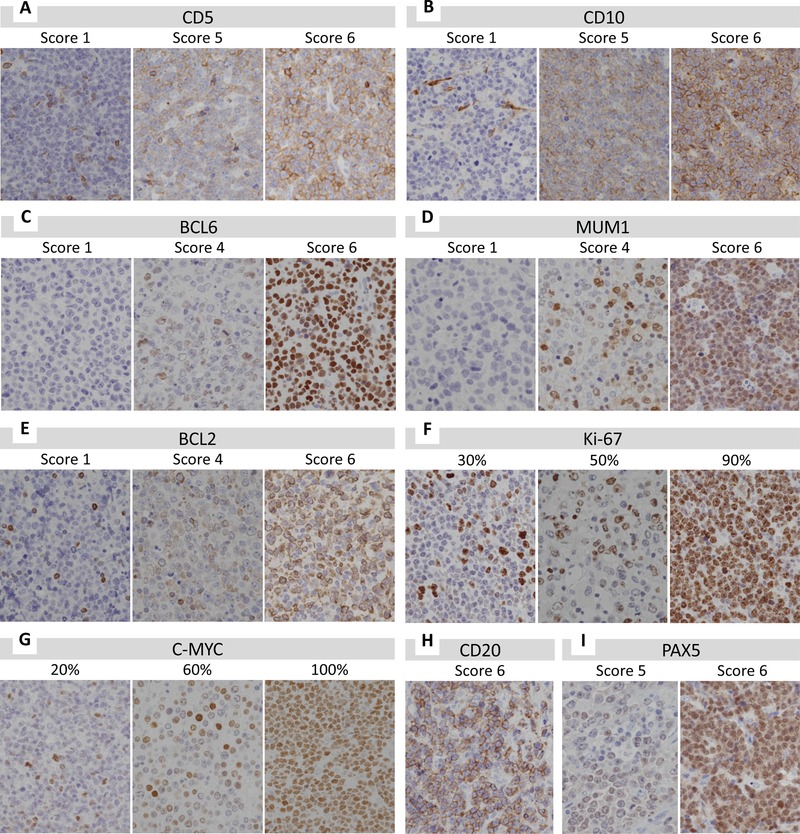
Experimental design: The expression of seven markers (CD5, CD10, BCL2, BCL6, MUM1, Ki-67, and C-MYC) is analyzed by RPPA and IHC using 37 DLBCL tissues, and the correlation between the two methods is determined. To normalize tumor content ratio in the tissues, the raw RPPA values of each marker are adjusted by that of CD20 or PAX-5.
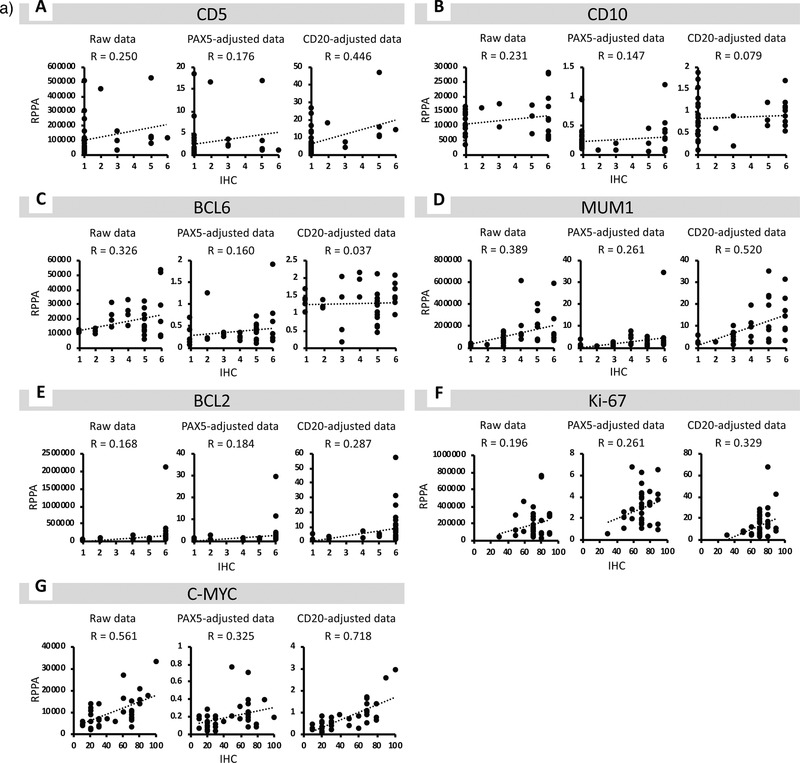
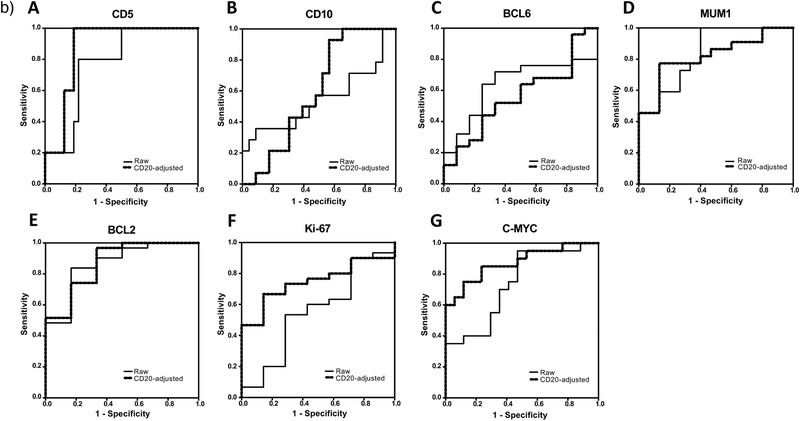
Results: The CD20-adjusted data for CD5, MUM1, BCL2, Ki-67, and C-MYC has better correlation with IHC results than PAX-5-adjusted data. Receiver operating characteristic (ROC) analysis reveals that CD5, MUM1, BCL2, and C-MYC exhibit a better sensitivity and specificity >0.750. Furthermore, the CD20-adjusted C-MYC value strongly correlates with that of IHC, and has a particularly high specificity (0.882).
Conclusions and clinical relevance: Although further investigation using a large number of DLBCL specimens needs to be conducted, these results suggest that RPPA could be applicable as a supportive tool for determining lymphoma prognosis.
Keywords: C-MYC; diffuse large B-cell lymphoma (DLBCL); immunohistochemistry (IHC); lymphoma prognosis; reverse-phase-protein-array (RPPA).
© 2019 The Authors. Proteomics - Clinical Application published by WILEY-VCH Verlag GmbH & Co. KGaA, Weinheim.
Conflict of interest statement
The authors declare no conflict of interest.
Figures
Comment in
-
Quantification of Biomarker Proteins Using Reverse-Phase Protein Arrays.Proteomics Clin Appl. 2020 Jul;14(4):e1900120. doi: 10.1002/prca.201900120. Epub 2020 Feb 28. Proteomics Clin Appl. 2020. PMID: 32109350
References
-
- The Non‐Hodgkin's Lymphoma Classification Project , Blood 1997, 89, 3909. - PubMed
-
- Hans C. P., Weisenburger D. D., Greiner T. C., Gascoyne R. D., Delabie J., Ott G., Muller‐Hermelink H. K., Campo E., Braziel R. M., Jaffe E. S., Pan Z., Farinha P., Smith L. M., Falini B., Banham A. H., Rosenwald A., Staudt L. M., Connors J. M., Armitage J. O., Chan W. C., Blood 2004, 103, 275. - PubMed
-
- Berglund M., Thunberg U., Amini R.‐M., Book M., Roos G., Erlanson M., Linderoth J., Dictor M., Jerkeman M., Cavallin‐Ståhl E., Sundström C., Rehn‐Eriksson S., Backlin C., Hagberg H., Rosenquist R., Enblad G., Mod. Pathol. 2005, 18, 1113. - PubMed
-
- Alizadeh A. A., Eisen M. B., Davis R. E., Ma C., Lossos I. S., Rosenwald A., Boldrick J. C., Sabet H., Tran T., Yu X., Powell J. I., Yang L., Marti G. E., Moore T., Hudson J. Jr, Lu L., Lewis D. B., Tibshirani R., Sherlock G., Chan W. C., Greiner T. C., Weisenburger D. D., Armitage J. O., Warnke R., Levy R., Wilson W., Grever M. R., Byrd J. C., Botstein D., Brown P. O., et al., Nature 2000, 403, 503. - PubMed
-
- Taniguchi M., Oka K., Hiasa A., Yamaguchi M., Ohno T., Kita K., Shiku H., Blood 1998, 91, 1145. - PubMed
Publication types
MeSH terms
Substances
LinkOut - more resources
Full Text Sources
