. 2019 Nov 13;17(11):e3000534.
doi: 10.1371/journal.pbio.3000534. eCollection 2019 Nov.

The effects of soil phosphorus content on plant microbiota are driven by the plant phosphate starvation response

Affiliations

The effects of soil phosphorus content on plant microbiota are driven by the plant phosphate starvation response

Omri M Finkel et al. PLoS Biol. .

Abstract

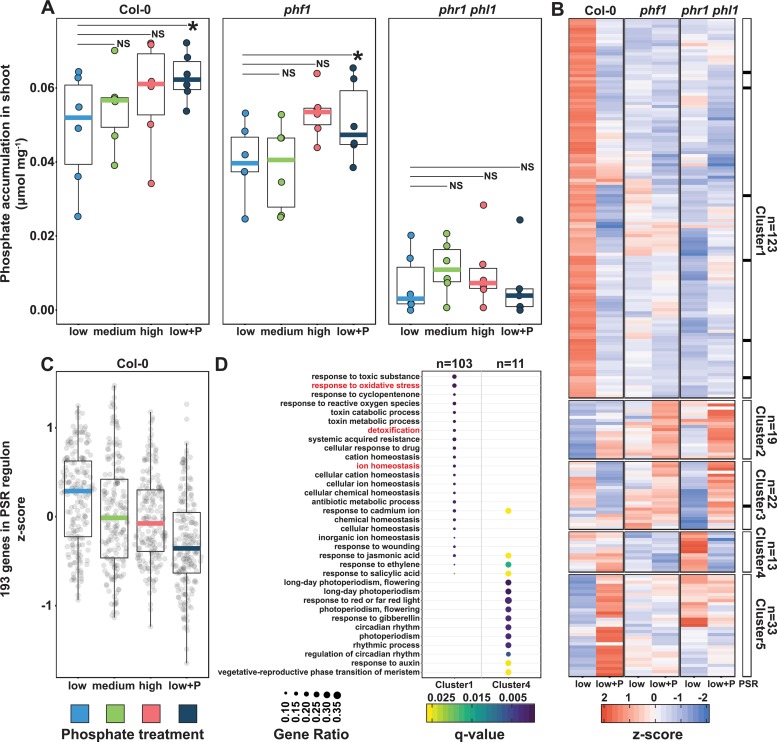
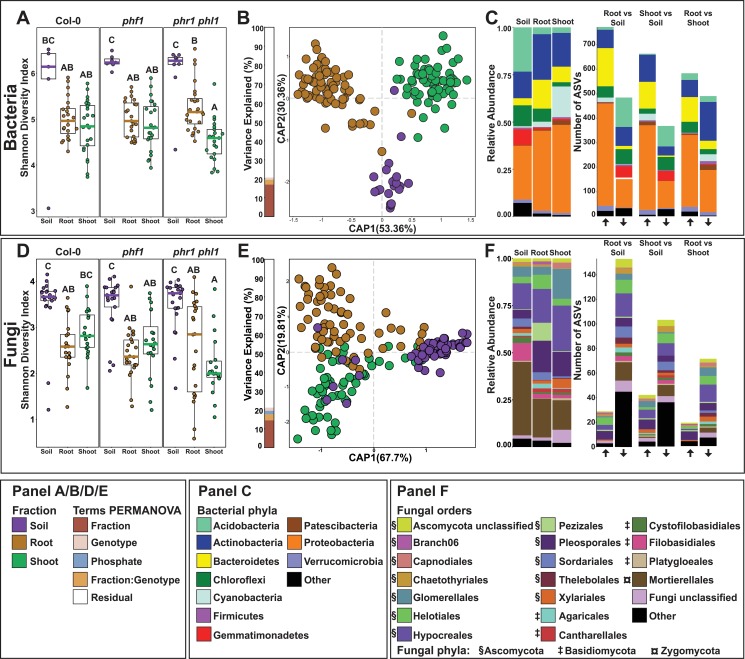
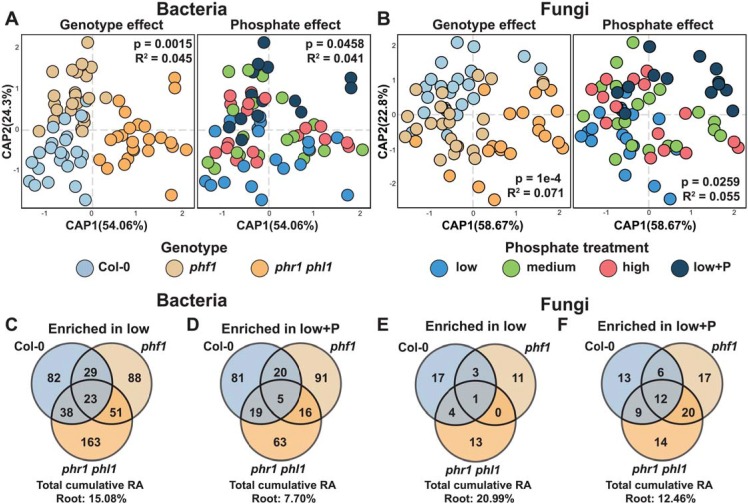
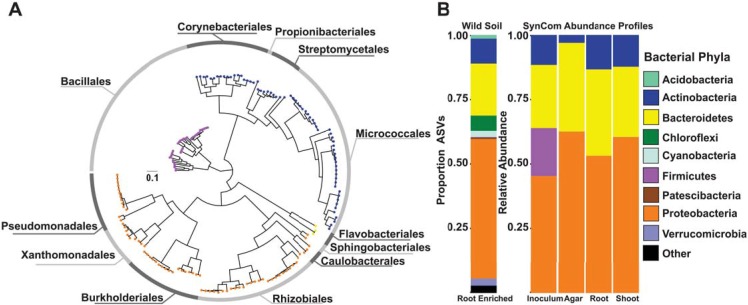
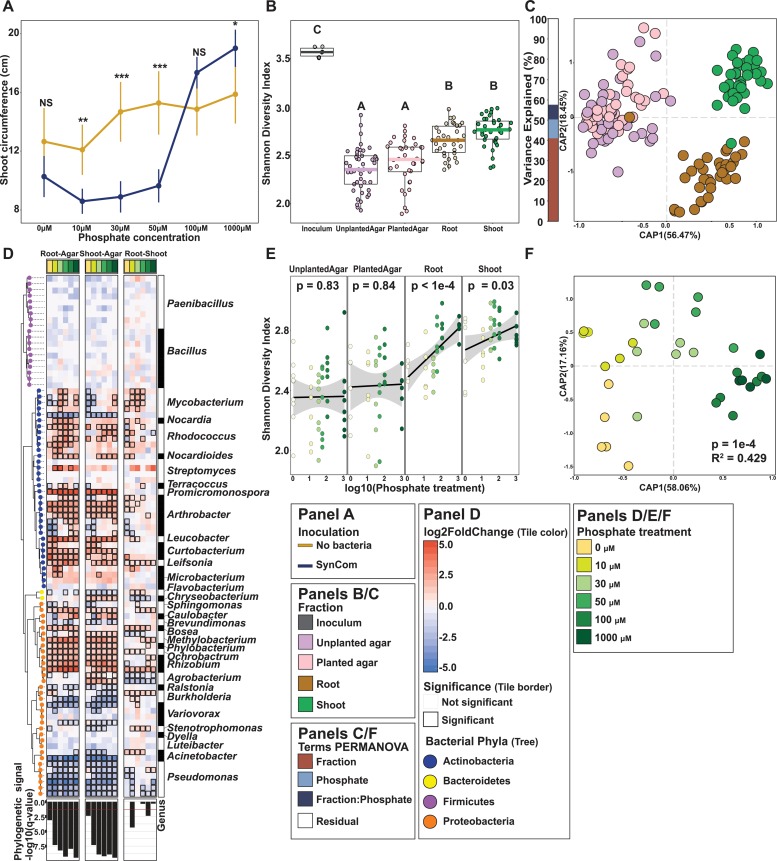
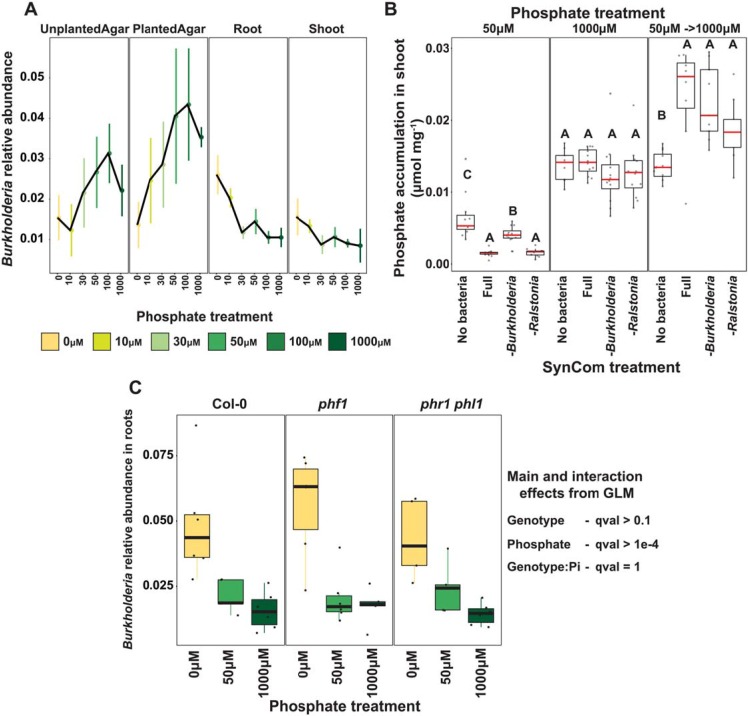
Phosphate starvation response (PSR) in nonmycorrhizal plants comprises transcriptional reprogramming resulting in severe physiological changes to the roots and shoots and repression of plant immunity. Thus, plant-colonizing microorganisms-the plant microbiota-are exposed to direct influence by the soil's phosphorus (P) content itself as well as to the indirect effects of soil P on the microbial niches shaped by the plant. The individual contribution of these factors to plant microbiota assembly remains unknown. To disentangle these direct and indirect effects, we planted PSR-deficient Arabidopsis mutants in a long-term managed soil P gradient and compared the composition of their shoot and root microbiota to wild-type plants across different P concentrations. PSR-deficiency had a larger effect on the composition of both bacterial and fungal plant-associated microbiota than soil P concentrations in both roots and shoots. To dissect plant-microbe interactions under variable P conditions, we conducted a microbiota reconstitution experiment. Using a 185-member bacterial synthetic community (SynCom) across a wide P concentration gradient in an agar matrix, we demonstrated a shift in the effect of bacteria on the plant from a neutral or positive interaction to a negative one, as measured by rosette size. This phenotypic shift was accompanied by changes in microbiota composition: the genus Burkholderia was specifically enriched in plant tissue under P starvation. Through a community drop-out experiment, we demonstrated that in the absence of Burkholderia from the SynCom, plant shoots accumulated higher ortophosphate (Pi) levels than shoots colonized with the full SynCom but only under Pi starvation conditions. Therefore, Pi-stressed plants are susceptible to colonization by latent opportunistic competitors found within their microbiome, thus exacerbating the plant's Pi starvation.


Conflict of interest statement

The authors have declared that no competing interests exist

Figures

Fig 1
Fig 1. Plants respond to differential P conditions in soil.
(A) Free phosphate content normalized by shoot fresh weight (mmol·mg−1) across wt Col-0 plants and 2 PSR mutants, phf1 and phr1 phl1. Statistical significance between low P and low+P treatments was determined across each genotype independently by a paired t test (p < 0.05). (B) Heat map showing the average standardized expression of 210 DEGs across the low P and low+P samples in the Col-0, phf1 and phr1 phl1 genotypes. The black bar to the right highlights the distribution of 7 genes belonging to the in vitro defined PSR marker genes [4] across the 5 clusters in the heat map. (C) Average expression of 193 PSR marker genes [4] across the 4 phosphorus regimes in the Col-0 genotype. (D) GO enrichment for Clusters 1 and 4. Clusters 2, 3, and 6 did not show any statistically significant GO enrichment. The gene ratio is the proportion of genes per cluster that belong to a GO category. DEG, differentially expressed gene; GO, gene ontology; P, phosphorus; PSR, phosphate starvation response; wt, wild type.
Fig 2
Fig 2. Plant recruitment patterns of bacteria and fungi.
(A, D) Bacterial (A) and fungal (D) alpha diversity estimated using the Shannon Diversity Index. Letters represent post hoc test results, based on a full factorial ANOVA model. (B, E) CAP based on Bray-Curtis dissimilarities between bacterial (B) and fungal (E) communities across the soil, root, and shoot. The bar graph to the left of the CAP depicts the percentage of variance explained by statistically significant (p < 0.05) terms in a PERMANOVA model. (C) Left panel: Relative abundance profiles of the main bacterial phyla across the soil, root, and shoot fractions. Right panel: Number of statistically significant ASVs enriched in specific fractions. The arrows on the bottom of the panel denote the direction of the enrichment relative to the name of the contrast tested; the up arrow means enrichment in the left fraction of the contrast, whereas the down arrow means enrichment in the right fraction of the contrast (e.g., RootvsSoil, up arrow enriched in root relative to soil, bottom arrow enriched in soil relative to root). A detailed interactive visualization of the bacterial enrichment patterns across the multiple taxonomic levels can be found at https://itol.embl.de/tree/1522316254174701551987253. (F) Left panel: Relative abundance profiles of the main fungal orders across soil, root, and shoot fractions. Right Panel: Number of statistically significant ASVs enriched in specific fractions. The arrows on the bottom of the panel denote the direction of the enrichment relative to the name of the contrast tested; the up arrow signifies enrichment in the left fraction of the contrast, whereas the down arrow signifies enrichment in the right fraction of the contrast (e.g., RootvsSoil, up arrow enriched in root relative to soil, bottom arrow enriched in soil relative to root). Plot is colored by order. The symbols besides the colors in the legend denote phylum. A detailed interactive visualization of the fungal enrichment patterns across the multiple taxonomic levels can be found at https://itol.embl.de/tree/13656172137464831571097084. ASV, amplicon sequence variant; CAP, canonical analysis of principal coordinates; PERMANOVA, Permutational Multivariate Analysis of Variance.
Fig 3
Fig 3. Plant PSR controls the assembly of the plant microbiome.
(A, B) Canonical analysis of principal coordinates showing the influence of plant genotypes and soil P content over the (A) bacterial and (B) fungal communities in the root. The p-value and R2 values inside each plot are derived from a PERMANOVA model and correspond to the genotype and P term, respectively. (C, E) Venn diagrams showing the distribution of (C) bacterial and (E) fungal ASVs with statistically significant (q < 0.1) higher abundance in the low P treatment in comparison to the low+P treatment in the Col-0, phf1 and phr1 phl1 roots. (D, F) Venn diagrams showing the distribution of (D) bacterial and (F) fungal ASVs with statistically significant (q < 0.1) higher abundance in the low+P treatment in comparison to the low P treatment across the Col-0, phf1 and phr1 phl1 roots. ASV, amplicon sequence variant; P, phosphorus; PERMANOVA, Permutational Multivariate Analysis of Variance; PSR, phosphate starvation response; RA, relative abundance.
Fig 4
Fig 4. Bacterial SynCom reproduces the typical plant-associated taxonomic distribution found in soil.
(A) Phylogenetic tree of 185 bacterial genomes included in the SynCom. The tree tips are colored according to the phylum classification of the genome in panel B; the outer ring shows the distribution of the 12 distinct bacterial orders present in the SynCom. (B) Left Panel: Proportion of ASVs enriched in the root in comparison to the natural soil across all treatments and genotypes based on a fitted GLM (q < 0.1). Each ASV is colored according to its phylum-level classification. Right Panel: Relative abundance profiles of bacterial isolates across the initial bacterial inoculum, planted agar, root, and shoot fractions. Each isolate is colored according to its phylum-level classification based on the genome-derived taxonomy. ASV, amplicon sequence variant; GLM, generalized linear model; SynCom, synthetic community.
Fig 5
Fig 5. Synthetic bacterial communities display deterministic community assembly in plants.
(A) Strip chart displaying the average shoot size of Col-0 Arabidopsis grown across a Pi gradient either in sterile conditions or with the SynCom. Each dot in the scatter plot represents the mean value for that particular treatment; the range crossing each dot represents the 95% confidence interval calculated. The lines are drawn to connect the means. (B) Alpha diversity across the fractions sampled was estimated using the Shannon Diversity index. An ANOVA model followed up by a Tukey HSD test were applied to estimate differences between inoculum, unplanted agar, planted agar, root, and shoot fractions. Letters represent the results of the post hoc test. (C) CAP based on Bray-Curtis dissimilarities between bacterial communities across the 4 fractions sampled. The bar graph to the left of the CAP depicts the percentage of variability explained by statistically significant (p < 0.05) terms in the PERMANOVA model. (D) Enrichment patterns of the SynCom. Each row along the different panels of the figure represents a USeq: a USeq encompasses a set of indistinguishable V3-V4 16S rRNA sequences present in the 185-member SynCom. Phylogenetic tree (on the left) is colored based on the phylum-level classification of the corresponding USeq. Each column in the heat maps represents a specific contrast in the enrichment model. We calculated root versus agar (left heat map), shoot versus agar (middle heat map), and root versus shoot (right heat map) enrichments within each Pi treatment (e.g., Root_0Pi versus Agar_0Pi). The heat maps are colored based on log2 fold changes derived from the fitted GLM. Positive fold changes (colored in red gradient) represent enrichments on the left side of the name of the contrast (e.g., Root-Agar, enriched in root in comparison to agar), whereas negative fold changes (colored in blue gradient) represent enrichments on the right side of the name of the contrast (e.g., Root-Agar, enriched in agar in comparison to agar). Boxed cells represent statistically significant enrichment/depletion. The bottom panel depicts the transformed (−log10) q-value derived from a phylogenetic signal Pagel’s λ test. Tests were performed per column in the heat map (e.g., Root0μM Pi versus Agar0μM Pi). (E) Bacterial alpha diversity estimated using the Shannon Diversity index. p-values derived from a linear model are shown for each fraction. Linear regression line is shown in black and the 95% confidence interval is shaded in gray. (F) CAP showing the influence of phosphate on the bacterial communities in the root. The bar graphs to the left of the CAP depict the percentage of variability explained by statistically significant (p < 0.05) variables based on a PERMANOVA model. CAP, canonical analysis of principal coordinates; GLM, generalized linear model; HSD, Honestly Significant difference; PERMANOVA, Permutational Multivariate Analysis of Variance; Pi, orthophosphate; SynCom, synthetic community; USeq, unique sequence.
Fig 6
Fig 6. Bacterial strains respond to Pi-stress-induced physiological changes in the wt plants.
(A) Relative abundance of Burkholderia Useqs, both of which exhibit a statistically significant (q < 0.1) Pi-enrichment between the plant fractions and the agar fraction. The middle dot of each strip bar corresponds to the mean of that particular condition, the range of the strip bar corresponds to the 95% confidence interval of the mean. The lines are drawn connecting the means for each Pi concentration. (B) Box plots showing the phosphate accumulation in plants exposed to different SynComs across 3 phosphate treatments. Statistically significant differences among SynCom treatments were computed within each phosphate treatment separately using an ANOVA model. Letters represent the results of the post hoc test. (C) Box plot showing relative abundance of Burkholderia USeqs across 3 Pi concentrations and 3 plant genotypes. Summary of the NB-GLM for Burkholderia is shown on the right. GLM, generalized linear model; NB, no bacteria; Pi, orthophosphate; SynCom, synthetic community; USeq, unique sequence; wt, wild type.

References

    1. Desbrosses GJ, Stougaard J. Root Nodulation: A Paradigm for How Plant-Microbe Symbiosis Influences Host Developmental Pathways. Cell Host Microbe. 2011;10: 348–358. 10.1016/j.chom.2011.09.005 - DOI - PubMed
    1. Hacquard S, Kracher B, Hiruma K, Münch PC, Garrido-Oter R, Thon MR, et al. Survival trade-offs in plant roots during colonization by closely related beneficial and pathogenic fungi. Nat Commun. Nature Publishing Group; 2016;7: 11362 10.1038/ncomms11362 - DOI - PMC - PubMed
    1. Dangl JL, Jones JDG. Plant pathogens and integrated defence responses to infection. Nature. 2001;411: 826–833. 10.1038/35081161 - DOI - PubMed
    1. Castrillo G, Teixeira PJPL, Paredes SH, Law TF, de Lorenzo L, Feltcher ME, et al. Root microbiota drive direct integration of phosphate stress and immunity. Nature. 2017;543: 513–518. 10.1038/nature21417 - DOI - PMC - PubMed
    1. Hacquard S, Spaepen S, Garrido-Oter R, Schulze-Lefert P. Interplay Between Innate Immunity and the Plant Microbiota. Annu Rev Phytopathol. Annual Reviews; 2017;55: 565–589. 10.1146/annurev-phyto-080516-035623 - DOI - PubMed

Publication types