. 2019 Nov 12;29(7):1832-1847.e8.
doi: 10.1016/j.celrep.2019.10.024.

Single-Cell Transcriptomics Uncovers Zonation of Function in the Mesenchyme during Liver Fibrosis

Affiliations

Single-Cell Transcriptomics Uncovers Zonation of Function in the Mesenchyme during Liver Fibrosis

Ross Dobie et al. Cell Rep. .

Abstract

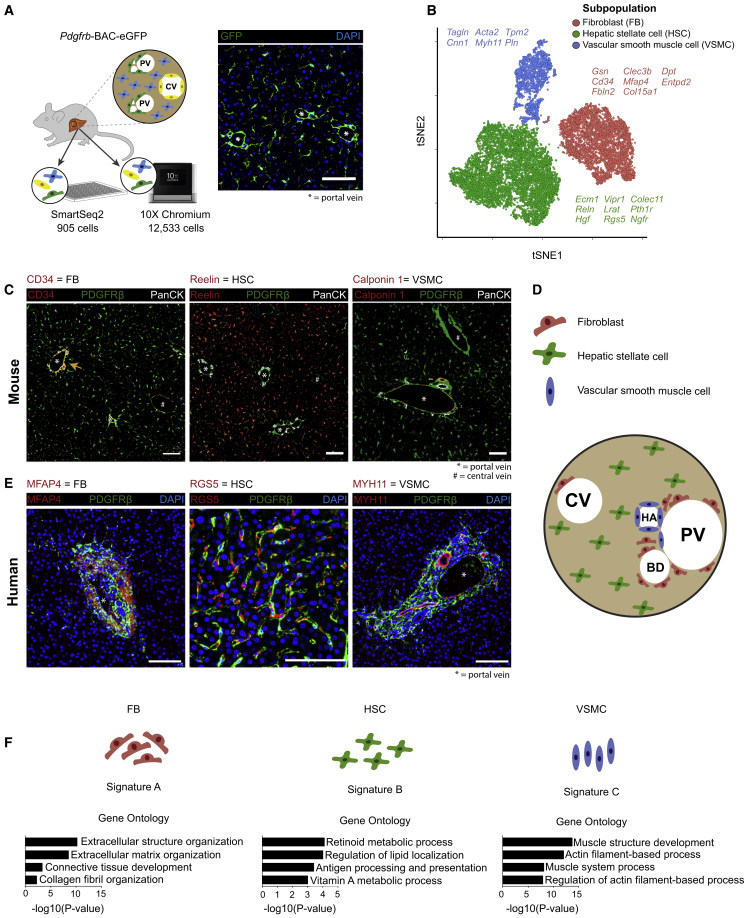
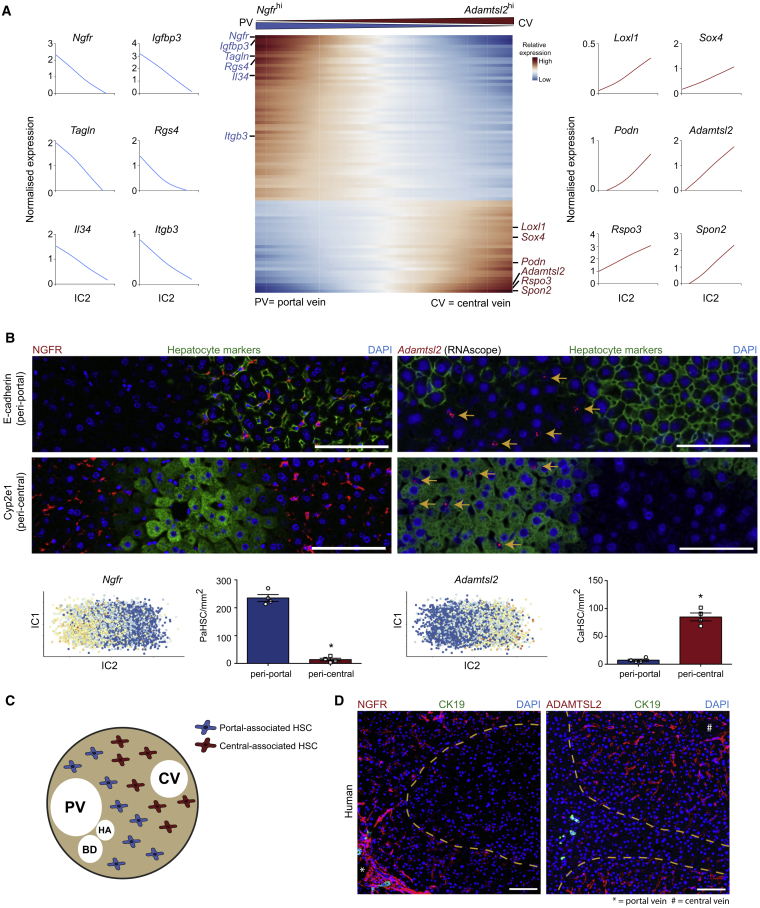
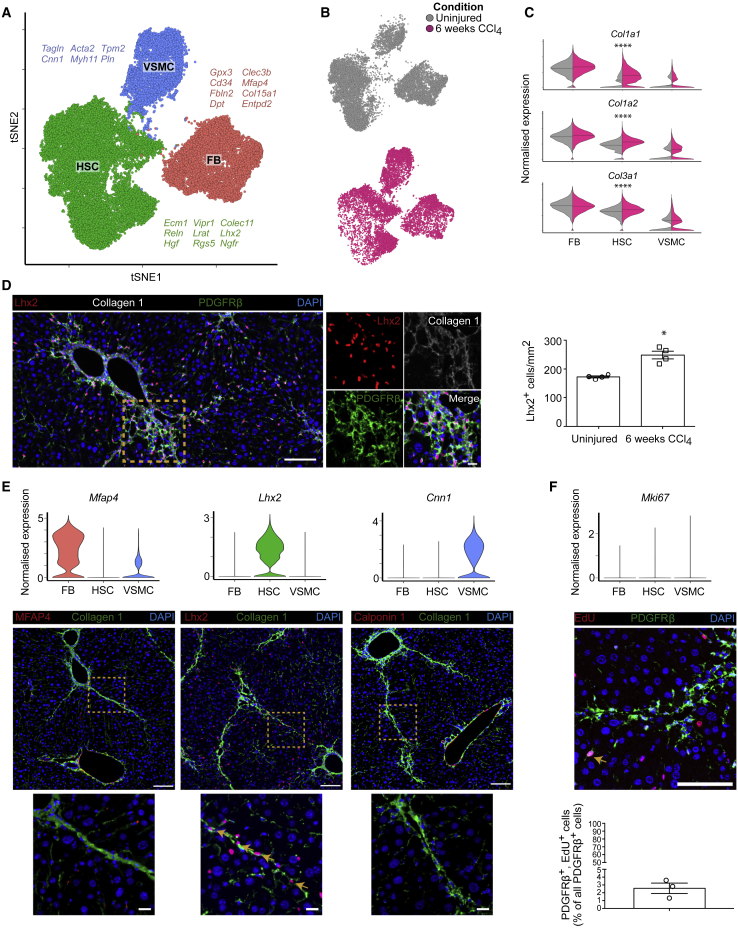
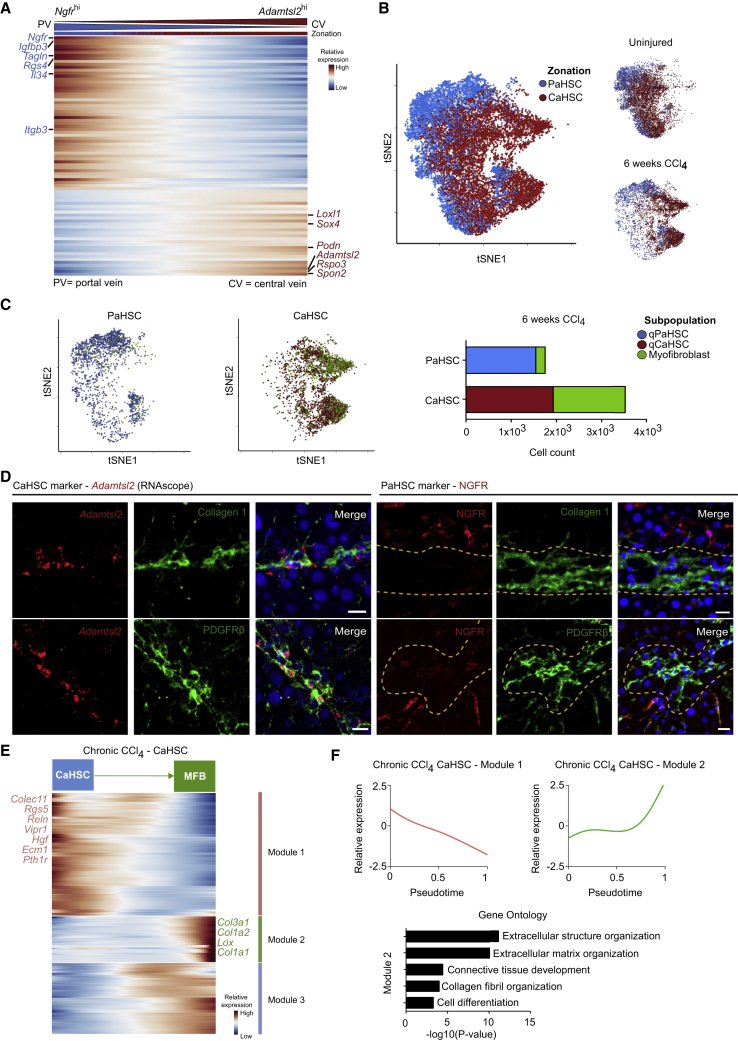
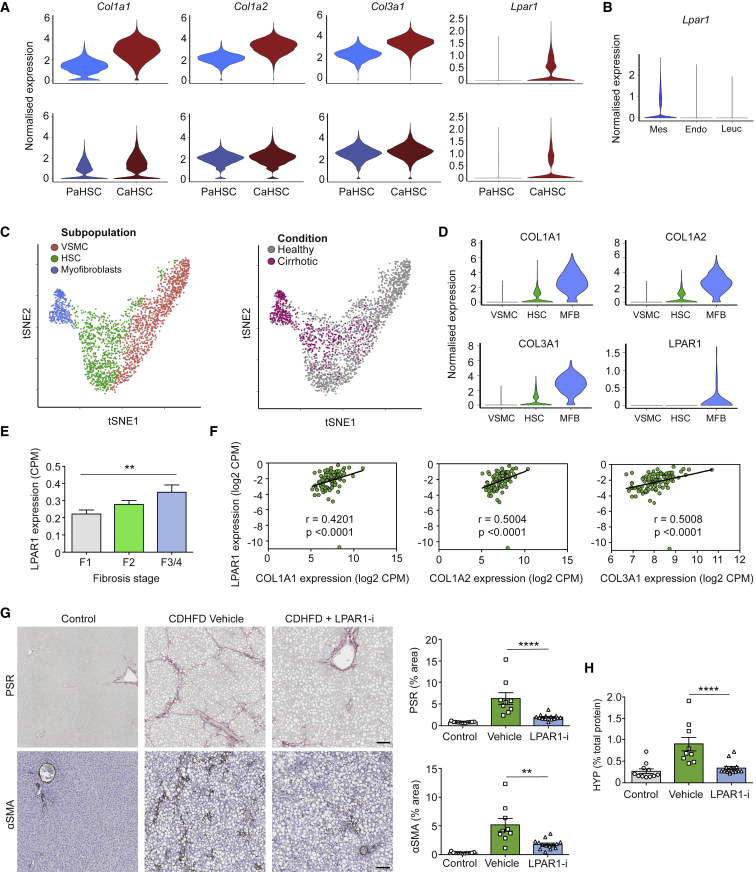
Iterative liver injury results in progressive fibrosis disrupting hepatic architecture, regeneration potential, and liver function. Hepatic stellate cells (HSCs) are a major source of pathological matrix during fibrosis and are thought to be a functionally homogeneous population. Here, we use single-cell RNA sequencing to deconvolve the hepatic mesenchyme in healthy and fibrotic mouse liver, revealing spatial zonation of HSCs across the hepatic lobule. Furthermore, we show that HSCs partition into topographically diametric lobule regions, designated portal vein-associated HSCs (PaHSCs) and central vein-associated HSCs (CaHSCs). Importantly we uncover functional zonation, identifying CaHSCs as the dominant pathogenic collagen-producing cells in a mouse model of centrilobular fibrosis. Finally, we identify LPAR1 as a therapeutic target on collagen-producing CaHSCs, demonstrating that blockade of LPAR1 inhibits liver fibrosis in a rodent NASH model. Taken together, our work illustrates the power of single-cell transcriptomics to resolve the key collagen-producing cells driving liver fibrosis with high precision.

Keywords: hepatic stellate cells; liver fibrosis; mesenchyme; single-cell RNA sequencing; zonation.


Conflict of interest statement

A.Z., S.V.P., T.E.H., M.M.W., G.R.B., and D.G.B. are employees and shareholders of Gilead Sciences, Inc.

Figures

None
Graphical abstract
Figure 1
Figure 1
Deconvolution of the Mouse Hepatic Mesenchyme Identifies Three Distinct Subpopulations in Liver Homeostasis (A) Overview: representative immunofluorescence image depicts GFP reporting in the liver of healthy Pdgfrb-BAC-eGFP reporter mice. Scale bar, 100 μm; portal vein () as indicated. CV, central vein; PV, portal vein. GFP+ cells were processed for droplet- and plate-based scRNA-seq. (B) t-Distributed stochastic neighbor embedding (t-SNE) visualization: 12,533 mesenchymal cells (median nGene = 2,268, nUMI = 5,725) cluster into three subpopulations. Selected marker genes are listed alongside each cluster. (C) Representative immunofluorescence images of healthy murine livers: CD34/Reelin/Calponin 1 (red), PDGFRβ (green), PanCK (white). Scale bar, 100 μm; portal vein () and central vein (#) as indicated. Yellow arrow indicates CD34+ fibroblasts. (D) Schematic representation of the topography of the three identified mesenchymal subpopulations in the liver. CV, central vein; PV, portal vein; HA, hepatic artery; BD, bile duct. (E) Representative immunofluorescence images of healthy human livers: MFAP4/RGS5/MYH11 (red), PDGFRβ (green), DAPI (blue). Scale bar, 100 μm; portal vein () as indicated. (F) GO enrichment terms associated with signatures A–C corresponding to the three identified mesenchymal subpopulations. See also Figures S1, S2, and S3.
Figure 2
Figure 2
Uncovering HSC Zonation across the Healthy Liver Lobule (A) Heatmap of relative expression (center): cubic smoothing spline curves fitted to markers of HSC zonation and plotted along IC2; genes are thresholded and ordered on their contribution to IC2, with top-most genes displaying the strongest negative correlation with bottom-most genes. Cells columns, genes rows. Zonation profiles for exemplar genes shown left and right. (B) Representative immunofluorescence and RNAscope images of healthy murine livers: NGFR/Adamtsl2 (RNAscope) (red), E-cadherin/Cyp2e1 (green), DAPI (blue). Scale bar, 100 μm. Yellow arrows indicate Adamtsl2+ cells. ICA visualizations (below): Ngfr and Adamtsl2 expression on the first and second independent components of the HSC subpopulation in homeostatic murine liver. Bar plots (below): number of PaHSCs (left; n = 4) and CaHSCs (right; n = 4) per mm2 in peri-portal and peri-central regions; error bars SEM, Mann-Whitney test, p < 0.05. (C) Schematic representation of the topography of the two HSC subpopulations in healthy liver lobule. CV, central vein; PV, portal vein; HA, hepatic artery; BD, bile duct. (D) Representative immunofluorescence images of healthy human livers: NGFR/ADAMTSL2 (red), CK19 (biliary epithelial cell marker; green), DAPI (blue). Scale bar, 100 μm; portal vein () and central vein (#) as indicated. Yellow dashed lines mark areas of low/neg marker staining. See also Figures S4 and S5.
Figure 3
Figure 3
HSCs Populate the Fibrotic Niche in a Mouse Model of Centrilobular Fibrotic Liver Injury (A) t-SNE visualization: 23,291 mesenchymal cells (median nGene = 2,339, nUMI = 6,081) from uninjured and fibrotic (6 weeks CCl4) mouse livers cluster into three subpopulations. FB, fibroblasts; HSC, hepatic stellate cells; VSMC, vascular smooth muscle cells. Selected marker genes listed alongside each cluster. (B) t-SNE visualizations: cells from uninjured (gray) and fibrotic (pink) livers. (C) Violin plots: expression of fibrillar collagen genes (Col1a1, Col1a2, and Col3a1) across the three subpopulations in uninjured (gray) versus fibrotic (pink) livers, bar indicates median. Mann-Whitney test, ∗∗∗∗p value < 0.0001. (D) Representative immunofluorescence images of fibrotic murine liver and quantification of Lhx2+ HSC in fibrotic versus uninjured murine liver: Lhx2 (red), collagen 1 (white), PDGFRβ (green), DAPI (blue). Scale bar, 100 μm. Yellow dashed line marks magnified area (scale bar, 20 μm). Bar plot (right): number of Lhx2+ cells per mm2 in uninjured (n = 4) and fibrotic (n = 4) liver; error bars SEM, Mann-Whitney test, p value < 0.05. (E) Violin plots (top): expression of mesenchymal cell subpopulation markers. Representative immunofluorescence images of fibrotic murine liver (below): MFAP4/Lhx2/Calponin 1 (red), collagen 1 (green), DAPI (blue). Scale bar, 100 μm. Yellow dashed line marks magnified area (scale bar, 20 μm). Yellow arrows indicate Lhx2+ cells within the fibrotic niche. (F) Violin plot (top): expression of proliferation marker Mki67 across the three mesenchymal subpopulations. Representative immunofluorescence images of fibrotic murine liver (middle): EdU (red), PDGFRβ (green), DAPI (blue). Scale bar, 100 μm. Bar plot (bottom): percentage EdU+ mesenchymal cells (n = 3); error bars SEM. Yellow arrow indicates proliferating PDGFRβ+ cell. See also Figure S6.
Figure 4
Figure 4
CaHSCs Are the Dominant Pathogenic Collagen-Producing Cells in a Mouse Model of Centrilobular Fibrotic Liver Injury (A) Heatmap of relative expression: cubic smoothing spline curves fitted to previously defined markers of zonation in murine HSCs, ordered by expression of Ngfr-associated (portal vein-associated) signature and annotated by cell condition. Cells columns, genes rows. (B) t-SNE visualizations: clustering HSCs from uninjured and fibrotic (6 weeks CCl4) livers on zonation signature separates them into distinct PaHSC and CaHSC clusters. (C) t-SNE visualizations: thresholding HSCs on expression of fibrillar collagen genes (Col1a1, Col1a2, and Col3a1), PaHSCs (left) versus CaHSCs (middle). qPaHSCs (blue) and qCaHSCs (red), HSCs below fibrillar collagen threshold, where q = quiescent HSC state; myofibroblast (green), HSCs above fibrillar collagen threshold. Bar plot (right): cell counts for PaHSCs versus CaHSCs from fibrotic livers. Green portion of bars represent HSCs above fibrillar collagen threshold. (D) Representative immunofluorescence and RNAscope images of fibrotic livers: Adamtsl2 (RNAscope)/NGFR (red), collagen 1/PDGFRβ (green), DAPI (blue). Scale bar, 20 μm. Yellow dashed line marks area of NGFRlo/neg HSCs. (E) Heatmap of relative expression: cubic smoothing spline curves fitted to genes differentially expressed across transition from quiescent CaHSC to myofibroblast, grouped by hierarchical clustering (k = 3). Gene co-expression modules labeled right. MFB, myofibroblast. (F) Cubic smoothing spline curves fitted to averaged relative expression of all genes in module 1 and module 2 along transition from quiescent CaHSC to myofibroblast; selected GO enrichment terms for module 2 (bottom). See also Figure S7.
Figure 5
Figure 5
CaHSCs Are the Dominant Pathogenic Collagen-Producing Cells following Acute Centrilobular Liver Injury (A) t-SNE visualization: clustering 7,260 HSC following acute CCl4 administration on zonation signature separates them into distinct PaHSC and CaHSC clusters (median nGene = 3,235, nUMI = 11,373). (B) t-SNE visualizations: Col1a1 and Mki67 gene expression. (C) Violin plots: expression of profibrogenic genes across PaHSC and CaHSC subpopulations, bar indicates median. Mann-Whitney test, ∗∗∗∗p < 0.0001. (D) Representative immunofluorescence and RNAscope images of murine livers following acute CCl4 administration: NGFR/Adamtsl2 (RNAscope) (red), Col1a1 (RNAscope) (green), DAPI (blue). Scale bar, 100 μm. Yellow dashed line marks magnified area (scale bar, 20 μm). Bar plot (right): PaHSC and CaHSC Col1a1 specificity within the fibrotic niche (n = 4); error bars SEM. Mann-Whitney test, p < 0.05. See also Figure S8.
Figure 6
Figure 6
CaHSCs, but Not PaHSCs, Differentiate into Pathogenic Collagen-Producing Cells following Acute Centrilobular Liver Injury (A) t-SNE visualization: RNA velocity field (black vectors) visualized using Gaussian smoothing on regular grid, superimposed on PaHSC and CaHSC clusters. (B) Annotating pseudotemporal dynamics (purple to yellow) on PaHSC (left) and CaHSC (right) clusters. Arrows indicate simplified overall trajectory. (C) Heatmap of relative expression: cubic smoothing spline curves fitted to genes differentially expressed across quiescent CaHSC to myofibroblast (MFB) (right arrow) and across quiescent to proliferating CaHSC (left arrow) pseudotemporal trajectories, grouped by hierarchical clustering (k = 3). Gene co-expression modules labeled right. (D) Cubic smoothing spline curves fitted to averaged expression of all genes in module 1 (top) along quiescent CaHSC to myofibroblast pseudotemporal trajectory, selected GO enrichment terms (right), and module 2 (bottom) along the quiescent to proliferating CaHSC pseudotemporal trajectory, selected GO enrichment terms (right). (E) Heatmap of relative expression: cubic smoothing spline curves fitted to genes differentially expressed across quiescent to proliferating PaHSC pseudotemporal trajectory, grouped by hierarchical clustering (k = 2). Gene co-expression modules labeled right. (F) Cubic smoothing spline curves fitted to averaged expression of all genes in module 2 along quiescent to proliferating PaHSC pseudotemporal trajectory, selected GO enrichment terms (right). (G) Representative immunofluorescence image of murine liver following acute CCl4-induced liver injury and EdU incorporation: NGFR (red), PDGFRβ (green), EdU (white), DAPI (blue). Scale bar, 100 μm. Bar plot (right): percentage EdU+ PaHSCs versus EdU+ CaHSCs (n = 3); error bars SEM. See also Figure S9.
Figure 7
Figure 7
Targeting of LPAR1 on Collagen-Producing HSCs Inhibits Liver Fibrosis (A) Violin plots: expression of fibrillar collagen genes (Col1a1, Col1a2, and Col3a1) and Lpar1 in PaHSCs versus CaHSCs following acute (72 h post single CCl4 injection; top) and chronic (6 weeks CCl4; bottom) liver injury. (B) Violin plot: expression of Lpar1 in hepatic mesenchymal cells (Mes), endothelial cells (Endo), and leucocytes (Leuc) from chronic liver. (C) t-SNE visualization (left): 2,210 mesenchymal cells from healthy and cirrhotic human livers cluster into three subpopulations. t-SNE visualization (right): cells from healthy (gray) and cirrhotic (pink) liver. (D) Violin plots: expression of fibrillar collagen genes (COL1A1, COL1A2, and COL3A1) and LPAR1 across the three human mesenchymal subpopulations. (E) Bar plot: LPAR1 gene expression (RNA-seq) from human FFPE liver samples at different stages of NASH (F1, n = 40; F2, n = 31; F3/4, n = 24); error bars SEM. Kruskal-Wallis test, ∗∗p < 0.01. (F) Scatterplot: correlation of LPAR1 expression (y axis) and fibrillar collagen genes (COL1A1, COL1A2, and COL3A1, x axis). r values are Spearman correlation coefficients, p < 0.0001. (G) Representative images of livers from control, CDHFD, and CDHFD + LPAR1 antagonist (LPAR1-i; 30 mg/kg, BID) rodents stained for collagen stain picrosirius red stain (PSR; top) and immunostained for myofibroblast activation marker alpha-smooth-muscle actin (αSMA; bottom). Scale bar, 100 μm. Bar plots (right): percentage area of tissue positive for PSR (top) or αSMA (bottom) (control, n = 11; vehicle, n = 9; LPAR1-i, n = 14); error bars SEM. Mann-Whitney test, ∗∗p < 0.01, ∗∗∗∗p < 0.0001. (H) Bar plot: hydroxyproline (HYP) levels in liver lysates from control, CDHFD (vehicle), and CDHFD + LPAR1 antagonist (LPAR1-i; 30 mg/kg) rodents (control, n = 11; vehicle, n = 9; LPAR1-i, n = 15); error bars SEM. Mann-Whitney test, ∗∗∗∗p < 0.0001. See also Figure S10.

References

    1. Aibar S., González-Blas C.B., Moerman T., Huynh-Thu V.A., Imrichova H., Hulselmans G., Rambow F., Marine J.C., Geurts P., Aerts J. SCENIC: single-cell regulatory network inference and clustering. Nat. Methods. 2017;14:1083–1086. - PMC - PubMed
    1. Arganda-Carreras I., Kaynig V., Rueden C., Eliceiri K.W., Schindelin J., Cardona A., Sebastian Seung H. Trainable Weka Segmentation: a machine learning tool for microscopy pixel classification. Bioinformatics. 2017;33:2424–2426. - PubMed
    1. Benjamini Y., Hochberg Y. Controlling the False Discovery Rate: A Practical and Powerful Approach to Multiple Testing. J. R. Stat. Soc. Series B. 1995;57:289–300.
    1. Bhunchet E., Wake K. Role of mesenchymal cell populations in porcine serum-induced rat liver fibrosis. Hepatology. 1992;16:1452–1473. - PubMed
    1. Bollong M.J., Yang B., Vergani N., Beyer B.A., Chin E.N., Zambaldo C., Wang D., Chatterjee A.K., Lairson L.L., Schultz P.G. Small molecule-mediated inhibition of myofibroblast transdifferentiation for the treatment of fibrosis. Proc. Natl. Acad. Sci. USA. 2017;114:4679–4684. - PMC - PubMed

Publication types