. 2019 Nov 12;29(7):1961-1973.e4.
doi: 10.1016/j.celrep.2019.10.019.

Sex Differences in the Blood Transcriptome Identify Robust Changes in Immune Cell Proportions with Aging and Influenza Infection

Affiliations

Sex Differences in the Blood Transcriptome Identify Robust Changes in Immune Cell Proportions with Aging and Influenza Infection

Erika Bongen et al. Cell Rep. .

Abstract

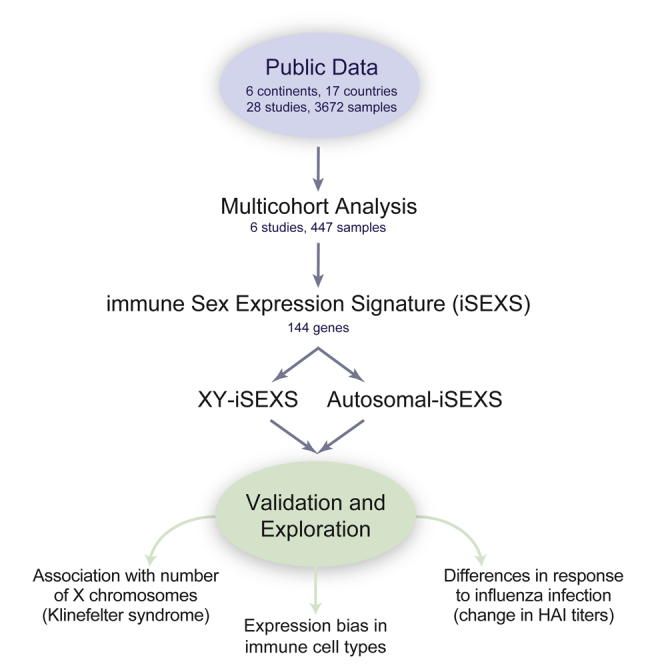
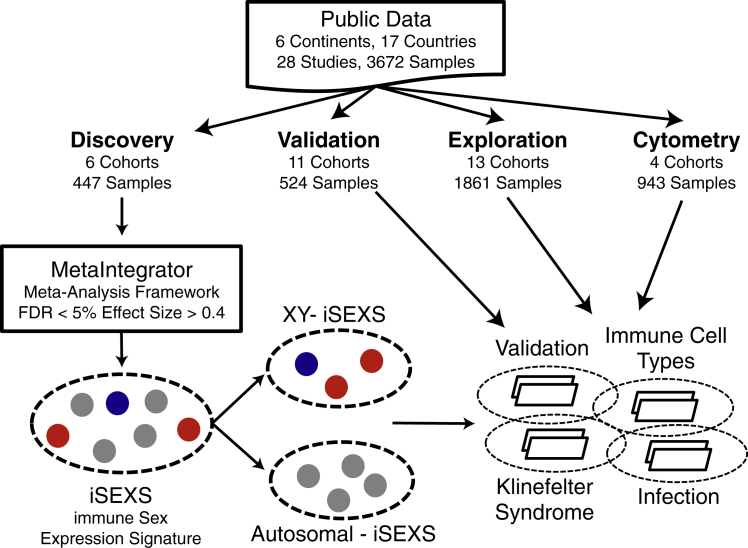
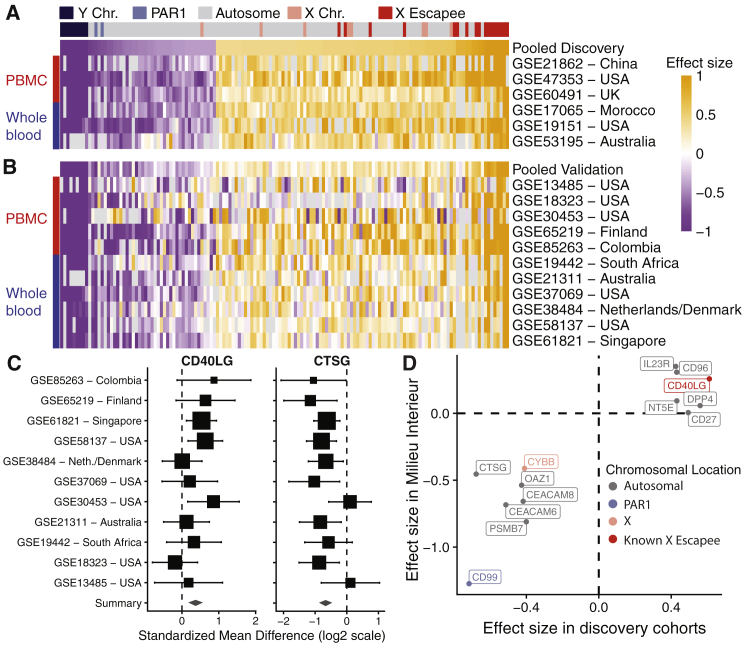
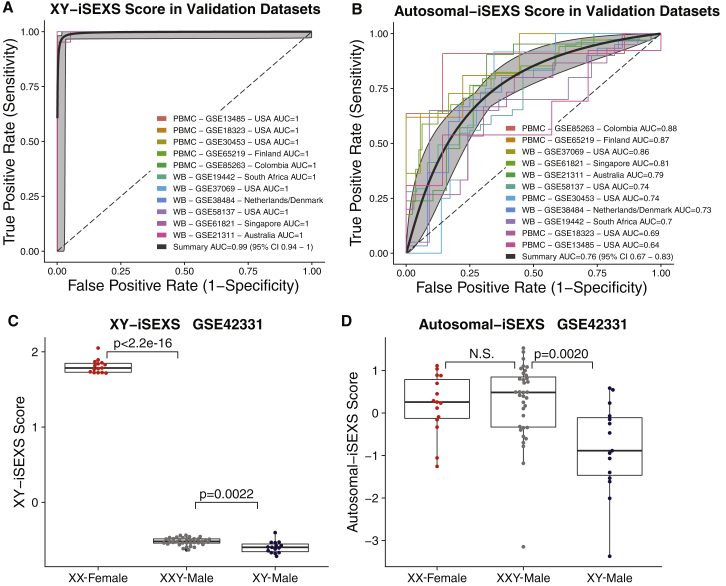
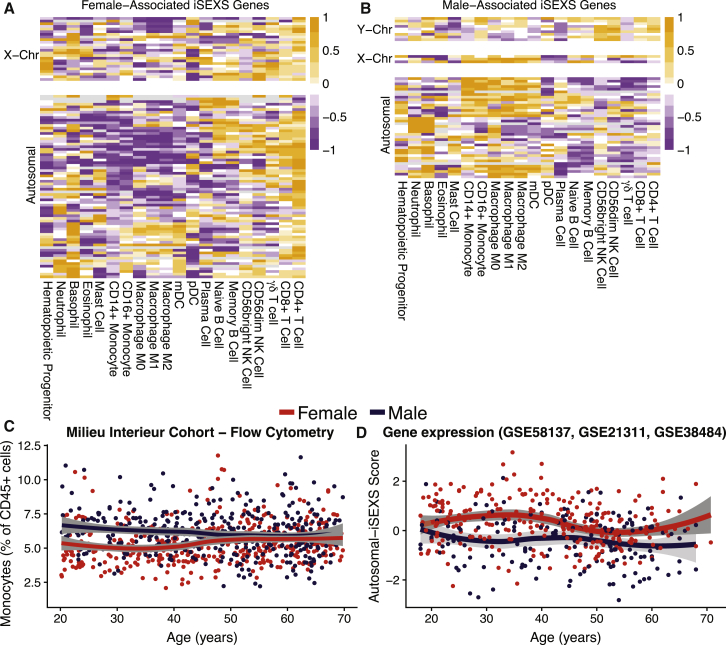
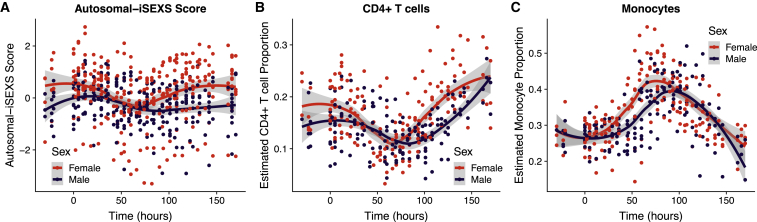
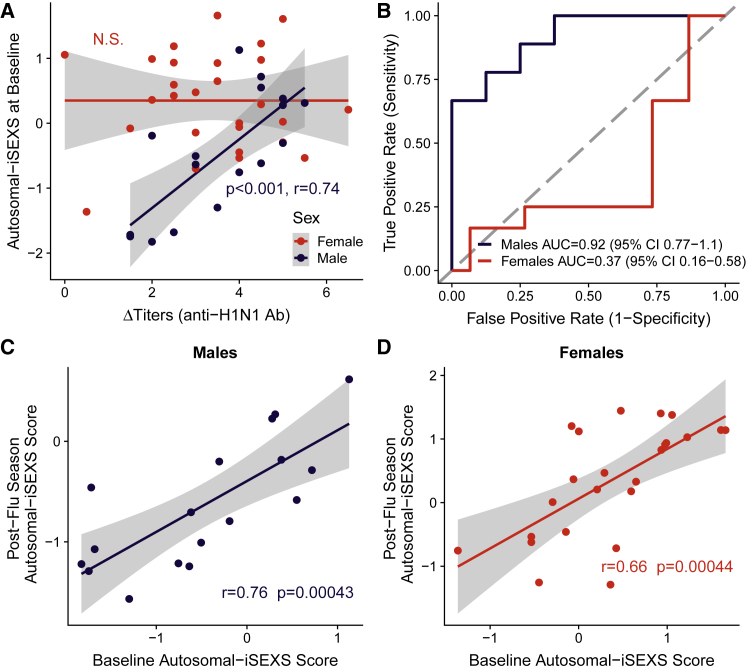
Sex differences in autoimmunity and infection suggest that a better understanding of molecular sex differences will improve the diagnosis and treatment of immune-related disease. We identified 144 differentially expressed genes, referred to as immune sex expression signature (iSEXS), between human males and females using an integrated multi-cohort analysis of blood transcriptome profiles from six discovery cohorts from five continents with 458 healthy individuals. We validated iSEXS in 11 additional cohorts of 524 peripheral blood samples. When we separated iSEXS into genes located on sex chromosomes (XY-iSEXS) or autosomes (autosomal-iSEXS), both modules distinguished males and females. iSEXS reflects sex differences in immune cell proportions, with female-associated genes showing higher expression by CD4+ T cells and male-associated genes showing higher expression by myeloid cells. Autosomal-iSEXS detected an increase in monocytes with age in females, reflected sex-differential immune cell dynamics during influenza infection, and predicted antibody response in males, but not females.

Keywords: CD4(+) T cells; aging; immune system; immunology; influenza; meta-analysis; monocytes; multi-cohort analysis; sex differences; transcriptome.


Conflict of interest statement

The authors declare no competing interests.

Figures

None
Graphical abstract
Figure 1
Figure 1
Identification, Validation, and Exploration of the Immune Sex Expression Signature (iSEXS) We downloaded publicly available gene expression microarray and flow cytometry datasets composed of 28 independent studies with 3,672 samples from 17 countries and 6 continents. We performed a meta-analysis of 6 Discovery cohorts with 447 samples to identify genes differentially expressed in the blood between healthy males and females 18–40 years old. We identified iSEXS as the genes with FDR <5% and |effect size| >0.4. We separated iSEXS based on chromosomal location into autosomal-iSEXS and XY-iSEXS. We tested autosomal-iSEXS and XY-iSEXS expression in 11 validation cohorts with 524 samples. Using 13 exploration cohorts with 1,861 samples, we examined autosomal-iSEXS and XY-iSEXS in Klinefelter syndrome, immune cells, and infection. We included some discovery and validation cohorts within exploration analyses.
Figure 2
Figure 2
Effect Sizes of iSEXS in Discovery and Validation (A and B) Heatmaps of effect sizes of iSEXS genes in (A) discovery and (B) validation cohorts. Each row is a dataset, and each column is a gene. The first row in each heatmap displays the pooled effect size across discovery or validation cohorts. Genes are ordered by increasing effect size in discovery cohorts in both heatmaps. The column color key indicates the chromosomal location of each gene (Y chromosome, dark blue; PAR1, light blue; autosome, gray; X chromosome, pink; known X-inactivation escape gene, red). The row color key indicates PBMC (red) or whole-blood (blue) datasets. Orange indicates a positive effect size for genes showing higher expression in females. Purple indicates a negative effect size for genes showing higher expression in males. (C) Forest plots of CD40LG and CTSG effect sizes in the validation cohorts. PAR1 = pseudoautosomal region 1; PBMC = peripheral blood mononuclear cell; and Neth = Netherlands. The x axis represents standardized mean difference between females and males, computed as Hedge's g, in log2 scale. The size of aorti rectangle is inversely proportional to the standard error of mean in the corresponding study. Whiskers represent the 95% confidence interval. The diamond represents the overall, combined mean difference for a given gene. Width of the diamond represents the 95% confidence interval of overall mean difference. (D) Comparison of the effect sizes of 13 iSEXS genes measured in the Milieu Interieur Consortium cohort of 279 healthy individuals 18-40 years old versus the effect sizes in discovery cohorts.
Figure 3
Figure 3
XY-iSEXS and Autosomal-iSEXS Performance in Typical Females, Typical Males, and Klinefelter Syndrome XXY Males (A and B) ROC plots of performance of the (A) XY-iSEXS score (summary AUC 0.99 (95% CI 0.94-1.0)) and the (B) Autosomal-iSEXS score (summary AUC 0.76 (95% CI 0.67-0.83)) to differentiate males and females. Grey areas indicate 95% confidence intervals. (C) Klinefelter syndrome XXY-males have significantly lower XY-iSEXS scores than XX females (t-test p < 2.2e-16) and significantly higher scores than XY-males (t-test p = 0.0022). (D) There is no significant difference between Autosomal-iSEXS scores of XX-females and XXY-males, but XXY-males have significantly higher Autosomal-iSEXS scores than XY-males (t-test p = 0.0020). See also Figures S1 and S2.
Figure 4
Figure 4
Cell-Type Enrichment of iSEXS Highlights CD4+ T Cells and Myeloid Cells (A and B) Heatmaps of centered and scaled immune cell type specific effect sizes of (A) female-associated and (B) male-associated iSEXS genes. Orange indicates a high effect size, for cell types that highly express that gene. Purple indicates a low effect size, for cell types that express that gene less. (C) Flow cytometry measured monocyte percentages of 816 healthy individuals from the Milieu Intérieur cohort. Two-way ANOVA was performed comparing the interaction of sex and age on monocyte proportions (sex p = 0.022; age p = 0.044; sexage interaction p = 0.00077). (D) Autosomal-iSEXS scores from 435 healthy individuals combined from GSE58137, GSE21311, and GSE38484. Two-way ANOVA was performed comparing the interaction of sex and age on autosomal-iSEXS scores (sex p = 0.00025; age p = 0.00013; sexage interaction p = 0.18). t tests were performed comparing autosomal-iSEXS scores of younger (18–40 years old) versus older (≥50 years old) females (p = 4.08e-5) as well as younger versus older males (p = 0.15). See also Figure S3.
Figure 5
Figure 5
Differential Effect of Influenza Infection on Autosomal-iSEXS Score in Males and Females In GSE73072, healthy volunteers were challenged with H1N1 or H3N2 influenza virus. (A) Autosomal-iSEXS score is shown at the time of infection (hour 0) and the subsequent 7 days. (B and C) Using immunoStates cell mixture deconvolution, (B) CD4+ T cell and (C) monocyte proportions were estimated over the course of influenza infection. See Figure S4 for XY-iSEXS time course.
Figure 6
Figure 6
Autosomal-iSEXS Score Prior to Influenza Infection Predicts Antibody Response, but Only in Males In GSE68310, healthy volunteers were followed at the beginning of flu season (baseline), during community-acquired influenza A infection and in the spring following flu season (post-flu season). (A) Autosomal-iSEXS scores correlate with the change in anti-H1N1 antibody titers in males (p < 0.001, Pearson's r = 0.74), but not females. Grey area indicates a 95% confidence interval. (B) Autosomal-iSEXS scores predict responder status in males (AUC = 0.92; 95% CI, 0.77-1.1), but not females (AUC = 0.37; 95% CI, 0.16-0.58). (C and D) Male (C) and female (D) autosomal-iSEXS scores at baseline significantly correlate with post-flu season scores. Pearson's correlation coefficient and p value are given. Grey area indicates a 95% confidence interval. See Figure S5 for XY-iSEXS score performance.

References

    1. Andres-Terre M., McGuire H.M., Pouliot Y., Bongen E., Sweeney T.E., Tato C.M., Khatri P. Integrated, multi-cohort analysis identifies conserved transcriptional signatures across multiple respiratory viruses. Immunity. 2015;43:1199–1211. - PMC - PubMed
    1. Barrett T., Wilhite S.E., Ledoux P., Evangelista C., Kim I.F., Tomashevsky M., Marshall K.A., Phillippy K.H., Sherman P.M., Holko M. NCBI GEO: archive for functional genomics data sets--update. Nucleic Acids Res. 2013;41:D991–D995. - PMC - PubMed
    1. Ben-Hur H., Mor G., Insler V., Blickstein I., Amir-Zaltsman Y., Sharp A., Globerson A., Kohen F. Menopause is associated with a significant increase in blood monocyte number and a relative decrease in the expression of estrogen receptors in human peripheral monocytes. Am. J. Reprod. Immunol. 1995;34:363–369. - PubMed
    1. Benjamini Y., Hochberg Y. Controlling the false discovery rate: a practical and powerful approach to multiple testing. J. R. Stat. Soc. B Stat. Methodol. 1995;57:289–300.
    1. Berry M.P., Graham C.M., McNab F.W., Xu Z., Bloch S.A., Oni T., Wilkinson K.A., Banchereau R., Skinner J., Wilkinson R.J. An interferon-inducible neutrophil-driven blood transcriptional signature in human tuberculosis. Nature. 2010;466:973–977. - PMC - PubMed

Publication types