. 2020 Jan 10;48(1):157-170.
doi: 10.1093/nar/gkz1075.

The histone variant H2A.Z in yeast is almost exclusively incorporated into the +1 nucleosome in the direction of transcription

Affiliations

The histone variant H2A.Z in yeast is almost exclusively incorporated into the +1 nucleosome in the direction of transcription

Dia N Bagchi et al. Nucleic Acids Res. .

Abstract

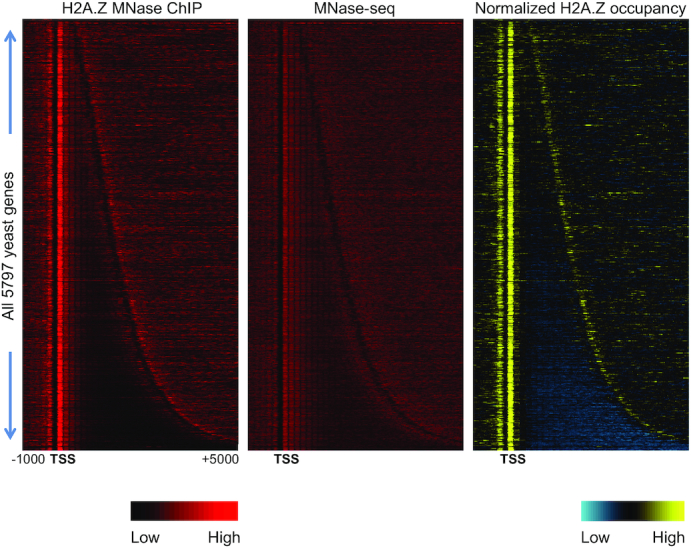
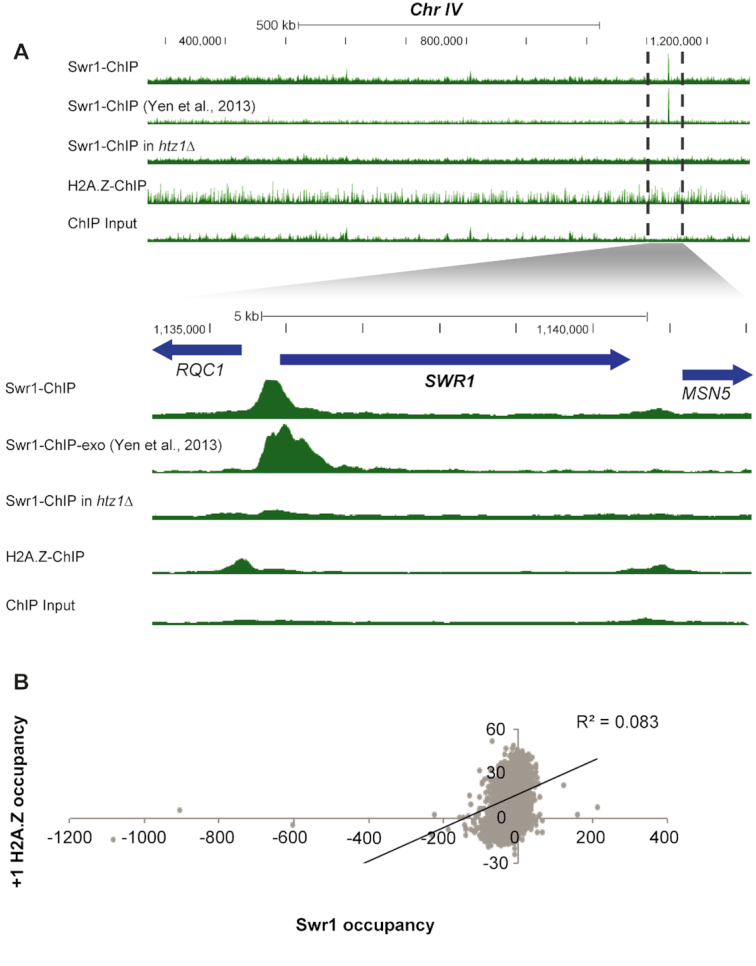
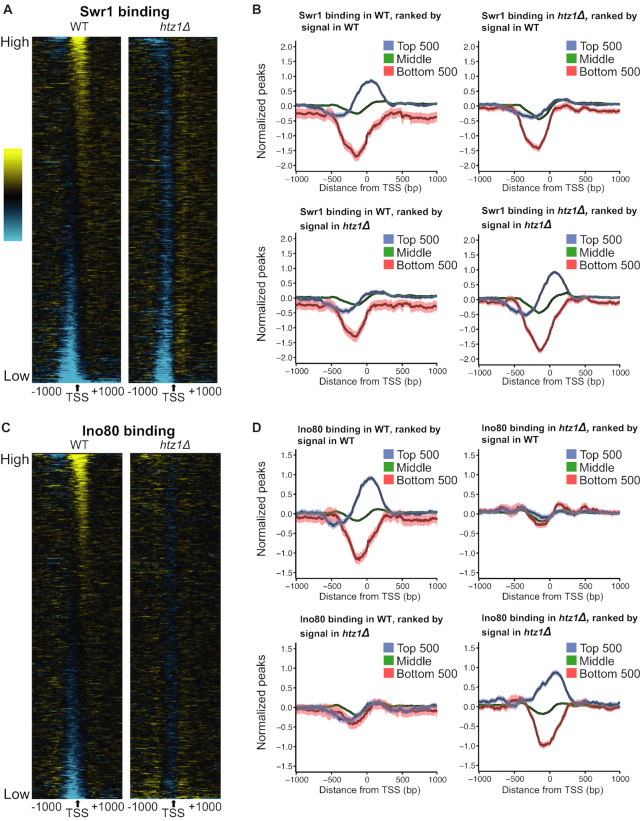
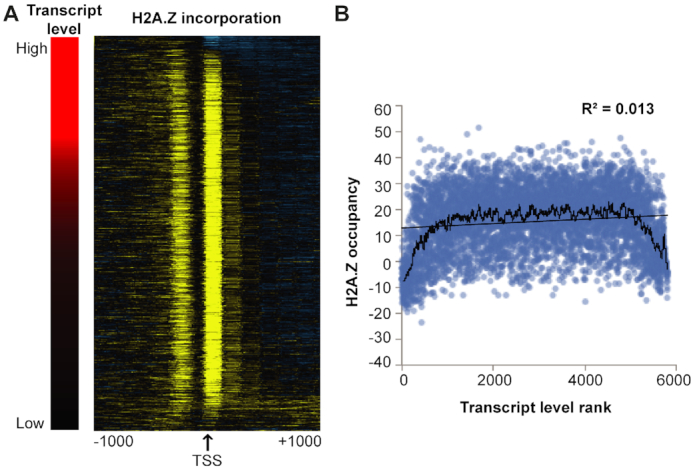
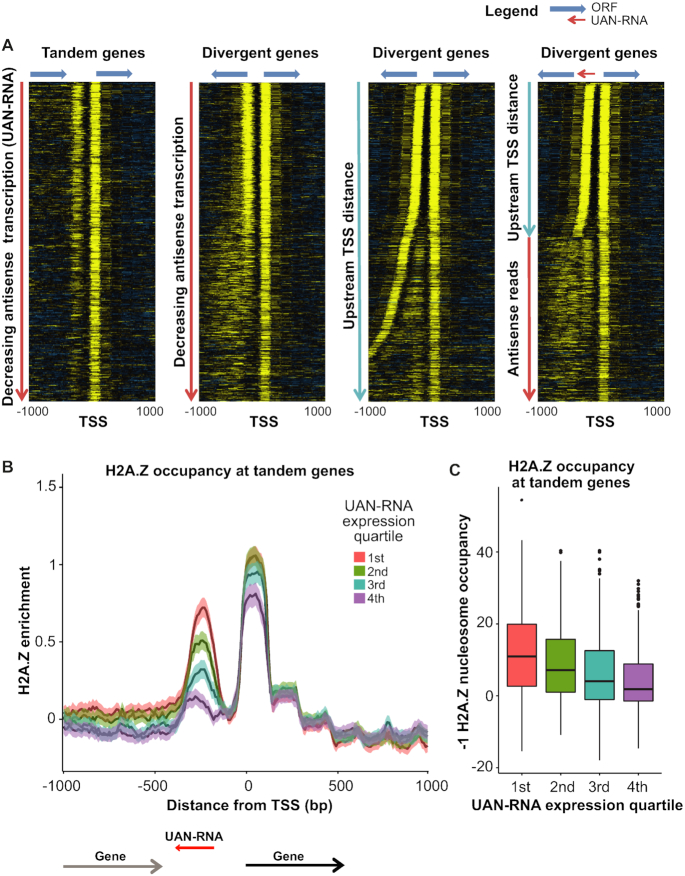
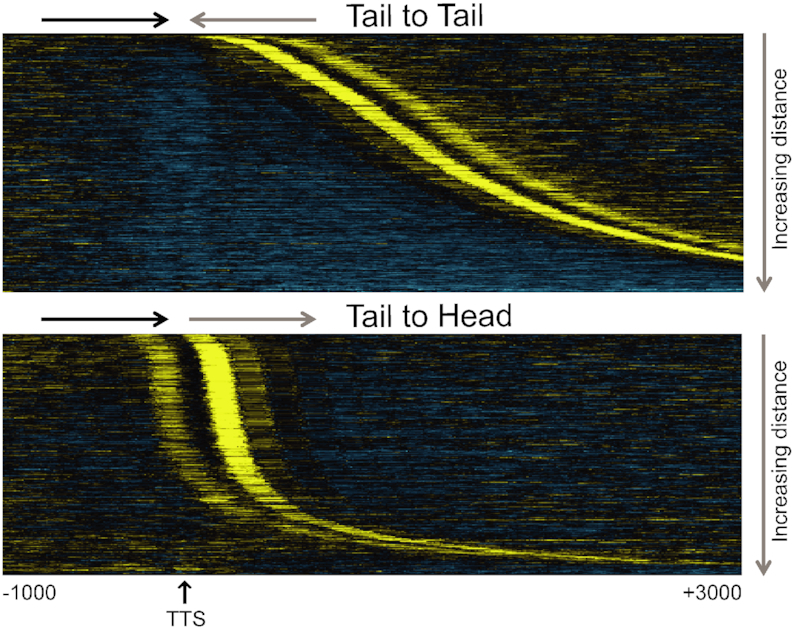
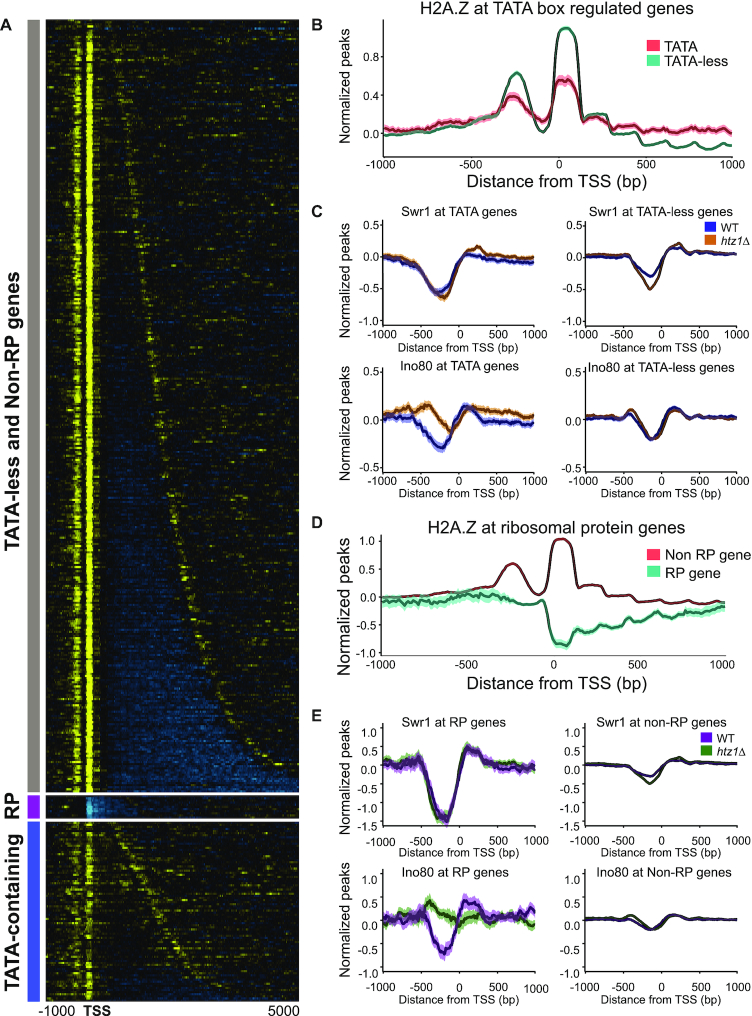
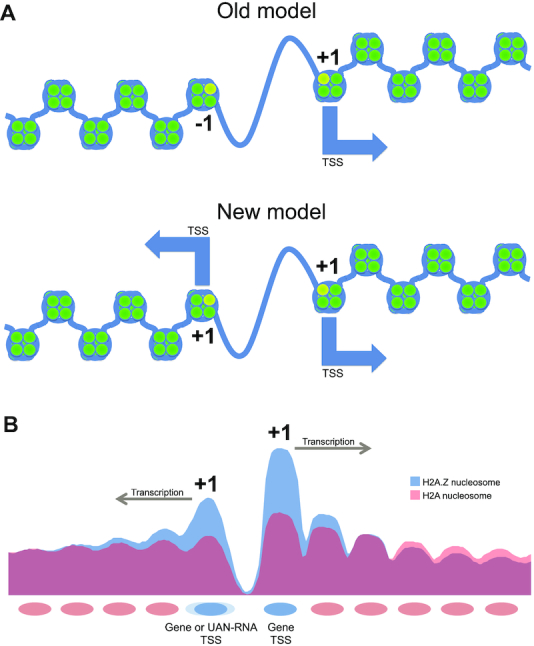
Transcription start sites (TSS) in eukaryotes are characterized by a nucleosome-depleted region (NDR), which appears to be flanked upstream and downstream by strongly positioned nucleosomes incorporating the histone variant H2A.Z. H2A.Z associates with both active and repressed TSS and is important for priming genes for rapid transcriptional activation. However, the determinants of H2A.Z occupancy at specific nucleosomes and its relationship to transcription initiation remain unclear. To further elucidate the specificity of H2A.Z, we determined its genomic localization at single nucleosome resolution, as well as the localization of its chromatin remodelers Swr1 and Ino80. By analyzing H2A.Z occupancy in conjunction with RNA expression data that captures promoter-derived antisense initiation, we find that H2A.Z's bimodal incorporation on either side of the NDR is not a general feature of TSS, but is specifically a marker for bidirectional transcription, such that the upstream flanking -1 H2A.Z-containing nucleosome is more appropriately considered as a +1 H2A.Z nucleosome for antisense transcription. The localization of H2A.Z almost exclusively at the +1 nucleosome suggests that a transcription-initiation dependent process could contribute to its specific incorporation.


Figures

Figure 1.
Figure 1.
Genome wide H2A.Z incorporation. Left: Heatmap of H2A.Z occupancy as measured by MNase ChIP-seq without input correction. Middle: Background nucleosome profiles in the input using standard MNase-seq. Right: Input-corrected MNase ChIP-seq data, with yellow indicating higher H2A.Z nucleosomal occupancy relative to background nucleosomes and blue indicating depletion of H2A.Z-containing nucleosomes relative to background nucleosomes. Genes are arranged by increasing length, revealing a peak of H2A.Z at the 5′ end and a less pronounced peak at the 3′ end, corresponding to the 5′ end of the nearest downstream gene.
Figure 2.
Figure 2.
Relationship of H2A.Z and Swr1 binding. (A) Swr1 binding depends on H2A.Z. ChIP-seq data tracks visualized on the UCSC Genome Browser, showing ∼850 kb of Chr IV containing the most prominent peak of Swr1 binding at its own promoter. The set of tracks below show a close-up of SWR1 indicated by dotted lines. Tracks have been scaled to normalize for differences in sequencing read depth. Swr1 binding at this strong site is greatly reduced in the htz1Δ mutant. (B) Correlation between Swr1 ChIP-seq signal between −350 to +150 relative to the TSS and the H2A.Z signal at the +1 nucleosome. The correlation is low, at ∼0.08.
Figure 3.
Figure 3.
Swr1 and Ino80 are redistributed in the absence of H2A.Z. (A) Heat map of Swr1 binding in WT and htz1Δ strains. ChIP-seq data was sorted by the signal in the WT strain between −200 and +200 bp surrounding the TSS, but the interval from −1000 to +1000 is displayed. (B) Average binding profiles of Swr1 across the TSS. Gene groups are determined as follows: Top: the top 500 genes by binding signal, Bottom: the bottom 500 genes by binding signal, Middle: the remaining 4797 annotated genes. The lighter shaded envelope around the average line is the 95% confidence interval. The top row of plots shows data grouped after sorting by the ChIP-seq signal in the WT strain. The bottom row plots contain data grouped after sorting by the ChIP-seq signal in the htz1Δ strain. (C) Same as A, but for Ino80 binding. (D) Same as B, but for Ino80 binding.
Figure 4.
Figure 4.
H2A.Z incorporation at the +1 nucleosome does not correlate with gene expression. (A) Heat map displaying H2A.Z incorporation across gene TSS regions (right) when sorted by transcript level as measured by read counts mapping to a transcript, normalized by transcript length (left). The H2A.Z occupancy data on the right is sorted according to the ranked transcript levels on the left. (B) H2A.Z occupancy at the +1 nucleosome plotted against ranked gene expression values. Ranking was used to accommodate outliers that would otherwise skew the plot. The black line represents a 50-gene moving average of H2A.Z occupancy levels.
Figure 5.
Figure 5.
H2A.Z incorporation at the −1 nucleosome increases with increasing antisense transcription. (A) H2A.Z occupancy data measured by MNase ChIP-seq is plotted for genes segregated based on the orientation of the upstream gene at the TSS. Tandem and divergent genes are first arranged by antisense transcription level in decreasing order (two left panels). The apparent correlation between antisense transcription and H2A.Z incorporation at the −1 nucleosome at divergent genes reflects differences in the intergenic distance between transcript TSS. At divergent genes, it is difficult to distinguish the nucleosome at the 5′ end of the upstream transcript from a nucleosome corresponding to the UAN-RNA transcript. To resolve these, in the second to last heatmap, divergent genes were sorted based on the distance to the upstream TSS. Finally, divergent genes with a TSS-to-TSS distance >350 bp were re-sorted based on the level of UAN-RNA transcription (right-most panel). (B and C) Tandem transcripts were grouped into quartiles according to their UAN-RNA transcription levels. (B) Average profiles are plotted for the quartiles. Overall, H2A.Z occupancy at the −1 nucleosome increases in concert with increasing UAN-RNA transcription level. (C) Boxplots of H2A.Z occupancy at the −1 nucleosome. Welch's t-tests and ANOVA were performed to compare the averages between the four groups, and all comparisons yielded P-values indicating that the differences were significant (P < 2.2 × 10⁻¹⁶).
Figure 6.
Figure 6.
H2A.Z localization by gene orientation at the TTS. Heat map showing H2A.Z localization at Tail-to-Tail (convergent) and Tail-to-Head (divergent) TTS orientation genes. The annotated TTS of the left-hand transcript is indicated, and the plot is sorted by increasing distance to the nearest downstream TSS of the gene on the right. Distances shown are in bp.
Figure 7.
Figure 7.
H2A.Z localization at the TSS with respect to the TATA box and at ribosomal protein genes. (A) Heatmap of H2A.Z localization at genes with TATA-less promoters, ribosomal protein (RP) genes, and TATA box-containing genes. Six RP genes also have TATA boxes in their promoters, but their H2A.Z occupancy pattern is similar to the other 130 RP genes. (B) Average H2A.Z levels across TATA-containing and TATA-less genes. Genes with TATA boxes show lower +1 and −1 nucleosome incorporation of H2A.Z, but also display increased H2A.Z levels in the gene body. (C) Swr1 and Ino80 binding levels at TATA-containing and TATA-less genes in WT and htz1Δ background strains. (D) Average H2A.Z occupancy levels across RP and non-RP genes. RP genes are strongly depleted for H2A.Z. (E) Swr1 and Ino80 binding levels at RP and Non-RP genes in WT and htz1Δ background strains.
Figure 8.
Figure 8.
Models of H2A.Z incorporation at the NDR. (A) Earlier view showing H2A.Z incorporation at both the +1 and −1 nucleosomes flanking the NDR at a promoter. The new model supported by our data shows that incorporation of H2A.Z at both sides of an NDR is indicative of transcription in both directions. Hence, −1 nucleosomes that incorporate H2A.Z are +1 nucleosomes of divergent transcripts. (B) Average nucleosome occupancy levels for both H2A.Z-containing nucleosomes and background H2A containing nucleosomes around the TSS.

References

    1. Yuan G.C., Liu Y.J., Dion M.F., Slack M.D., Wu L.F., Altschuler S.J., Rando O.J.. Genome-scale identification of nucleosome positions in S. cerevisiae. Science. 2005; 309:626–630. - PubMed
    1. Albert I., Mavrich T.N., Tomsho L.P., Qi J., Zanton S.J., Schuster S.C., Pugh B.F.. Translational and rotational settings of H2A.Z nucleosomes across the Saccharomyces cerevisiae genome. Nature. 2007; 446:572–576. - PubMed
    1. Iouzalen N., Moreau J., Mechali M.. H2A.ZI, a new variant histone expressed during Xenopus early development exhibits several distinct features from the core histone H2A. Nucleic Acids Res. 1996; 24:3947–3952. - PMC - PubMed
    1. Raisner R.M., Hartley P.D., Meneghini M.D., Bao M.Z., Liu C.L., Schreiber S.L., Rando O.J., Madhani H.D.. Histone variant H2A.Z marks the 5′ ends of both active and inactive genes in euchromatin. Cell. 2005; 123:233–248. - PMC - PubMed
    1. Gu M., Naiyachit Y., Wood T.J., Millar C.B.. H2A.Z marks antisense promoters and has positive effects on antisense transcript levels in budding yeast. BMC Genomics. 2015; 16:99. - PMC - PubMed

Publication types

MeSH terms