. 2019 Dec 16;47(22):11771-11789.
doi: 10.1093/nar/gkz1053.

A distinct class of eukaryotic MT-A70 methyltransferases maintain symmetric DNA N6-adenine methylation at the ApT dinucleotides as an epigenetic mark associated with transcription

Affiliations

A distinct class of eukaryotic MT-A70 methyltransferases maintain symmetric DNA N6-adenine methylation at the ApT dinucleotides as an epigenetic mark associated with transcription

Yuanyuan Wang et al. Nucleic Acids Res. .

Abstract

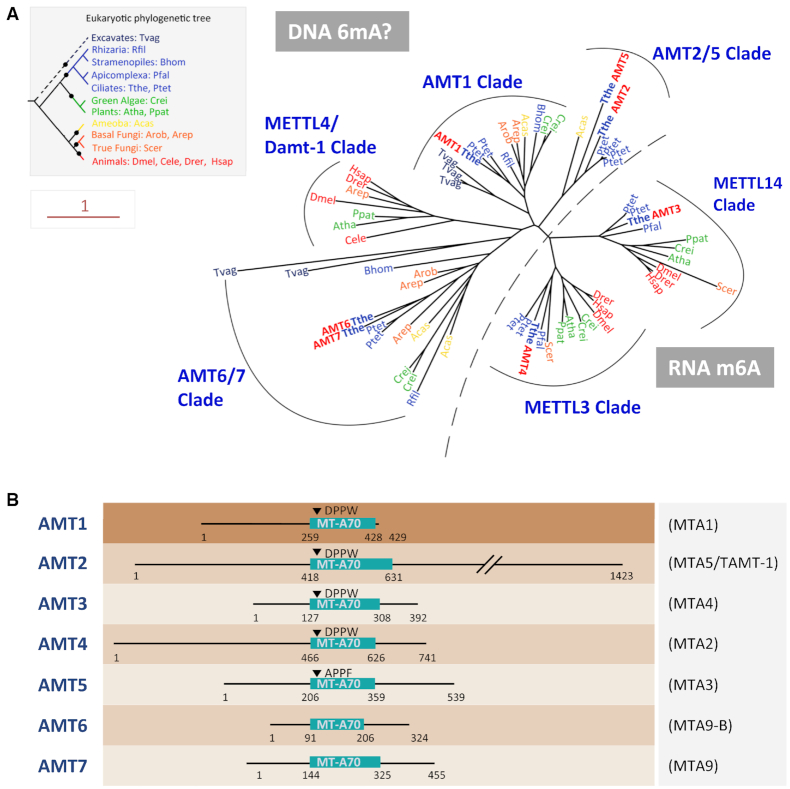
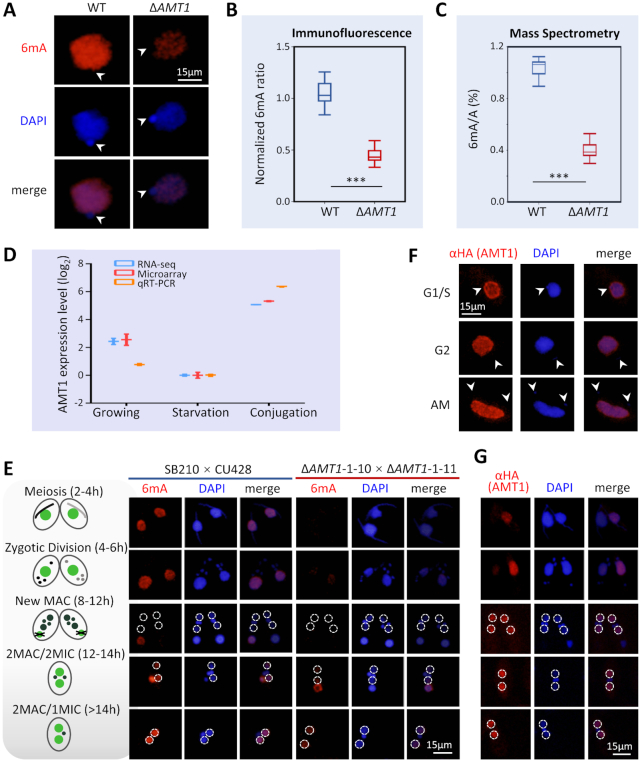
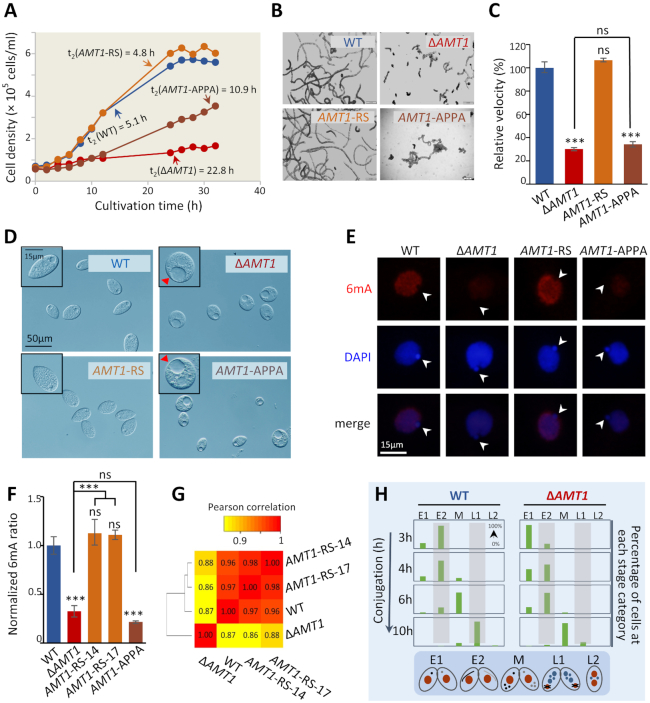
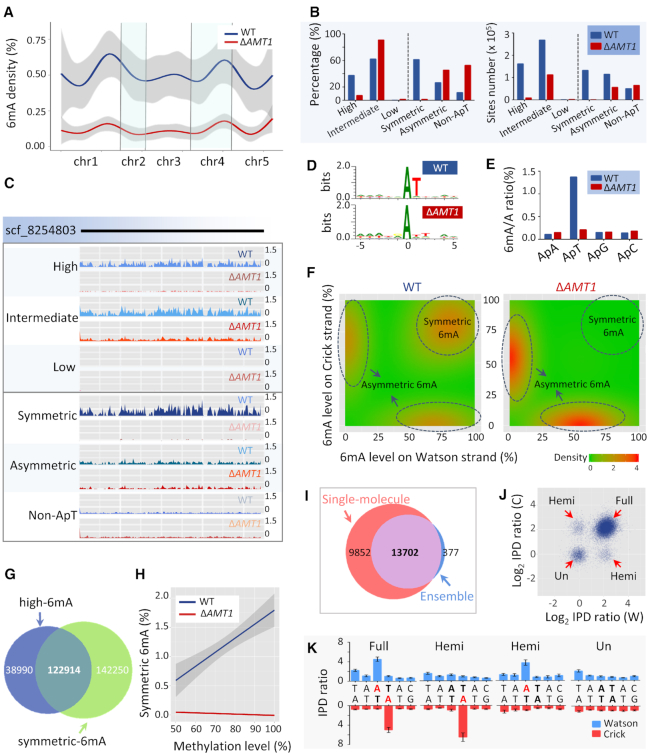
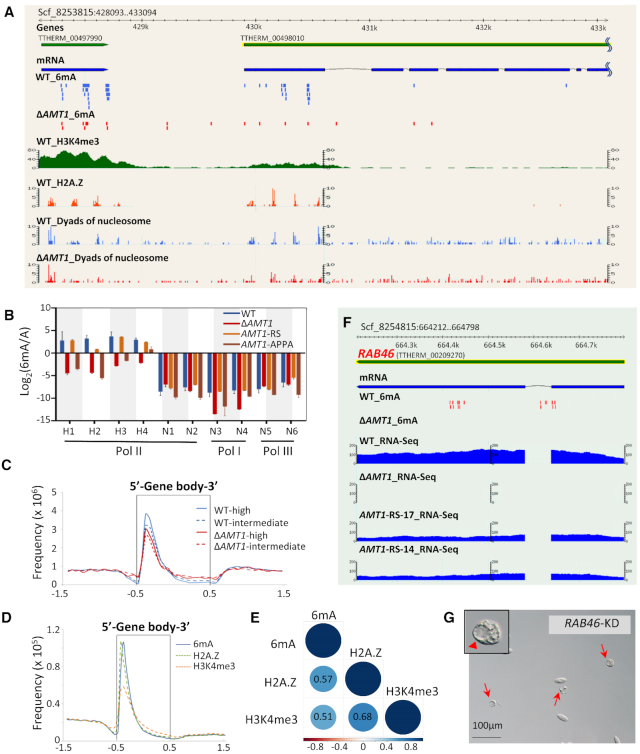
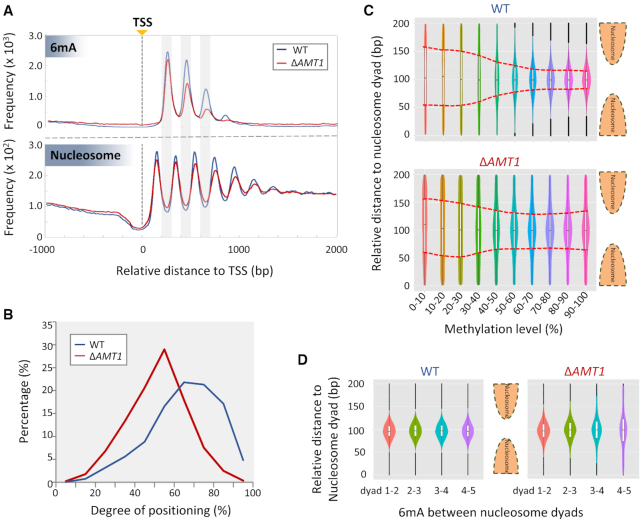
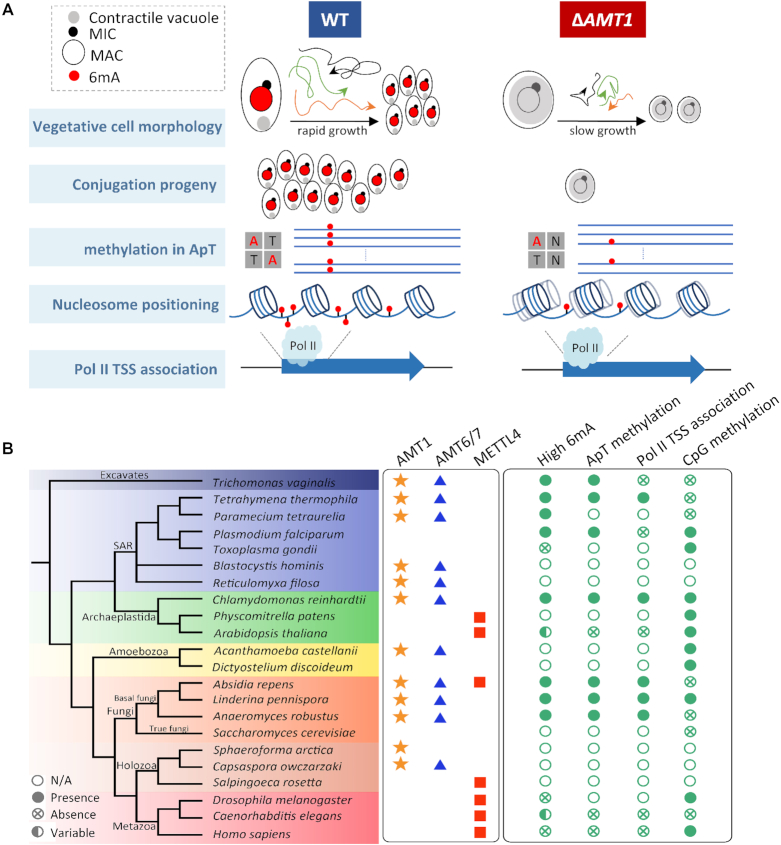
Rediscovered as a potential eukaryotic epigenetic mark, DNA N6-adenine methylation (6mA) varies across species in abundance and its relationships with transcription. Here we characterize AMT1-representing a distinct MT-A70 family methyltransferase-in the ciliate Tetrahymena thermophila. AMT1 loss-of-function leads to severe defects in growth and development. Single Molecule, Real-Time (SMRT) sequencing reveals that AMT1 is required for the bulk of 6mA and all symmetric methylation at the ApT dinucleotides. The detection of hemi-methylated ApT sites suggests a semi-conservative mechanism for maintaining symmetric methylation. AMT1 affects expression of many genes; in particular, RAB46, encoding a Rab family GTPase involved in contractile vacuole function, is likely a direct target. The distribution of 6mA resembles H3K4 methylation and H2A.Z, two conserved epigenetic marks associated with RNA polymerase II transcription. Furthermore, strong 6mA and nucleosome positioning in wild-type cells is attenuated in ΔAMT1 cells. Our results support that AMT1-catalyzed 6mA is an integral part of the transcription-associated epigenetic landscape. AMT1 homologues are generally found in protists and basal fungi featuring ApT hyper-methylation associated with transcription, which are missing in animals, plants, and true fungi. This dichotomy of 6mA functions and the underlying molecular mechanisms may have implications in eukaryotic diversification.


Figures

Figure 1.
Figure 1.
Phylogenetic analysis and domain structure comparison of AMTs 1–7. (A) Phylogenetic analysis of MT-A70 proteins. DNA 6mA (subclades AMT2/5, AMT1, METTL4/DAMT1 and AMT6/7) and RNA m6A (subclades METTL3 and METTL14) methyltransferase candidates are separated by a dotted line. Species are marked by different colors based on their phylogenetic position in the eukaryotic tree (inset). AMTs 1–7 of Tetrahymena are in bold plus red. The scale bar corresponds to 1 expected amino acid substitution per site. See Supplementary Table S9 for details (species full name and NCBI GI number). (B) Conserved domains and motifs in AMTs 1–7. Gene names used in Luo et al. (70) and Beh et al. (75) are shown in parentheses. MT-A70 domains of AMTs 1–5 were predicted by CD-Search (69), while domain structures of AMT6 and AMT7 were inferred from sequence alignment with AMTs 1–5.
Figure 2.
Figure 2.
Germline knockout of AMT1AMT1) dramatically reduced the DNA 6mA level. (A) Immunofluorescence (IF) staining of DNA 6mA in logarithmically growing WT and ΔAMT1 cells. Note the absence of 6mA signals in the MIC (arrowheads). (B) Statistical analysis of 6mA IF signal intensity in A. Cell images were randomly selected (WT: n = 263, ΔAMT1: n = 450) and processed by ImageJ. Data are presented as box plots (from top to bottom: max, first quartile, median, third quartile, and min). Student's t-test was performed. ***P < 0.001. (C) Mass spectrometry analysis of 6mA, performed on five biological replicates for WT and 39 for ΔAMT1. Data are presented as box plots. Student's t-test was performed. ***P < 0.001. (D) Expression profile of AMT1 during growth (mid-log phase, ∼3.5 × 10⁵ cells/ml), starvation (15 h after starvation) and conjugation (4 h post-mixing). Expression levels are represented by normalized RNA-seq reads numbers (http://tfgd.ihb.ac.cn/) (88), microarray signals (31) and quantitative RT-PCR data. All expression values (in logarithm scale) were compared with values during starvation (set at 0). (E) IF staining of DNA 6mA in conjugating WT and ΔAMT1 cells. Nuclear events are used to ascertain conjugation stages (see schematics on the left). The new MAC is outlined (dotted circles). Note that de novo occurrence of 6mA in the new MAC was dramatically reduced in ΔAMT1 cells. (F) IF staining of AMT1 in growing cells. AMT1 was HA-tagged at the N-terminus (HA-AMT1) and over-expressed under the control of the MTT1 promoter. After induction by cadmium chloride (1.5μg/ml, 30min), HA-AMT1 was detected by an α-HA antibody. Note the absence of AMT1 signals in the MIC (arrowheads). (G) IF staining of AMT1 in conjugating cells. Nuclear events are used to ascertain conjugation stages (see schematics on the left). Note that AMT1 signals appeared in the new MAC (dotted circles), before buildup of 6mA signals.
Figure 3.
Figure 3.
Growth and development were severely impaired in AMT1 loss-of-function mutants. (A) Growth rates of WT (SB210), ΔAMT1, AMT1-APPA and AMT1-rescued cells (AMT1-RS). Cells were enumerated using a Coulter counter at the indicated time points. Doubling time (h) were calculated based on the log-phase data. (B) Trajectory analysis of the swimming ability. Swimming paths of indicated cells in half a second were recorded and converted to illustrations by Image J. ΔAMT1 and AMT1-APPA cells swam much slower than WT cells. The swimming ability was restored in AMT1-RS cells. (C) Quantification of the translational swimming velocity. All values are normalized with that of WT cells. Data are presented as mean ± standard deviations. Student's t-test was performed. ***P < 0.001; ns: not significant (P > 0.05); compared with WT, unless indicated otherwise. (D) Contractile vacuoles (CVs) observed by phase-contrast microscopy. Abnormal CVs (red arrowheads) were observed in a large portion of ΔAMT1 and AMT1-APPA cells, but not in WT and AMT1-RS cells. (E) IF staining of 6mA in WT, ΔAMT1, AMT1-APPA and AMT1-RS cells. Note the absence of 6mA signal in the MIC (white arrowheads). (F) Mass spectrometry analysis of 6mA in WT, ΔAMT1, AMT1-APPA and AMT1-RS cells (two independent strains). Data are presented as mean ± standard deviations. Student's t-test was performed. ***P < 0.001; ns: not significant (P > 0.05); compared with WT, unless indicated otherwise. (G) Correlations in gene expression profiles. Pearson's correlation coefficients (PCC) were calculated for pair-wise comparison and represented by the color scale. Cluster analysis, based on PCC, is shown on the left. Note the similarities between the gene expression profiles of WT and AMT1-rescued cells (AMT1-RS-14 and AMT1-RS-17) and their distinction from that of ΔAMT1 cells. (H) Conjugation progress (h) of WT (SB210 × CU428) and ΔAMT1 (1–10 × 1–11) cells. Cells at each time point (n > 200) were classified into different developmental stages by their nuclear morphology: pre-meiosis (E1), meiosis (E2), mitosis (M), new MAC development (L1) and pair separation (L2) (89).
Figure 4.
Figure 4.
Deletion of AMT1 affected the genome-wide distribution of 6mA. (A) 6mA density (6mA/A) in WT (blue) and ΔAMT1 cells (red), across the assembled Tetrahymena MAC genome, which are concatenated according to their positions in the MIC chromosomes. (B) Classification of 6mA sites according to their methylation levels (left half) and symmetry (right half), in WT (blue) and ΔAMT1 cells (red). The left and right panels represent percentage (a particular class of 6mA/all 6mA) and the site numbers for the classes, respectively. See Supplementary Table S3 for details. (C) Normalized 6mA distribution on scaffold_8254803 (the longest in the Tetrahymena MAC genome assembly) in WT and ΔAMT1 cells. Classification of 6mA sites are the same as in (B). (D) Sequence logos for 6mA sites (at position 0) in WT and ΔAMT1 cells. (E) Relative distribution of 6mA in ApN (ApA/ApT/ApG/ApC) dinucleotides in WT (blue) and ΔAMT1 cells (red). Note the even distribution of 6mA on all four ApN dinucleotides in ΔAMT1 cells. (F) Density plot of 6mA distribution, according to methylation levels on Watson (x-axes) or Crick strands (y-axes) in WT (left panel) and ΔAMT1 cells (right panel). (G) Area-proportional Venn diagram representing highly methylated 6mA and symmetrically methylated 6mA in WT cells. (H) Relationship between methylation levels (x-axis) and proportion of symmetric 6mA sites (y-axis: symmetric 6mA/total 6mA) in WT (blue) and ΔAMT1 cells (red). The linear regression trendlines and 95% confidence intervals (very narrow for ΔAMT1 cells) are shown. (I) Area-proportional Venn diagram representing symmetrically methylated AT sites identified in the ensemble and 6mA-containing AT sites in single molecules. The analysis was limited to the two longest chromosomes in Tetrahymena (scf_8254667 and scf_8254697). (J) Different methylation states revealed by SMRT CCS. IPD ratios were calculated for A’s in symmetrically methylated AT sites (the intersection in (I)) of every single molecule. In the scatterplot, the strand-specific IPD ratios (log2 transformed) is explicitly denoted in the x- (Watson strand) and y-axes (Crick strand). Note the four distinct clusters in the plot representing different methylation states: The cluster near the origin represents the unmethylated state (IPD ratios≈1); the cluster in the upper-right corner represents the full methylation state (IPD ratios≈4 for both Watson and Crick strands); two other clusters represent the hemi-methylation state (IPD ratios ≈ 4 for either Watson or Crick strand). (K) Four single molecules representing different methylation states for the same AT site (scf_8254697: 1 830 057–1 830 062). For each DNA molecule, the mean IPD ratios and their dispersions for Watson and Crick strands are plotted for the 6-bp region containing the AT site.
Figure 5.
Figure 5.
AMT1 affects Pol II-transcribed genes. (A) Distributions of 6mA, H3K4me3, H2A.Z, and nucleosomes. In this GBrowse snapshot of a representative genomic region, tracks from top to bottom are: gene models, mRNA transcripts, 6mA (WT in blue, ΔAMT1 in red), H3K4me3 (X-ChIP coverage), dyads of nucleosomes containing H2A.Z, and dyads of nucleosomes (WT in blue, ΔAMT1 in red). Note the biased distribution of 6mA toward the 5′ end of a long gene (TTHERM_00498010). (B) Validating the methylation states of 10 GATC sites by DpnI/DpnII digestion. The sites were selected for their location on genes transcribed by different RNA polymerases (Pol I, II and III), and their methylation levels calculated from SMRT sequencing data (H1-H4: high methylation; N1-N6: no methylation; all in WT cells). Genomic DNA was digested with DpnI or DpnII; qPCR was performed with primers flanking the GATC sites to quantify undigested DNA (Supplementary Table S6). Y-axis represents the ratios between the methylated and unmethylated state (Log2 transformed), deduced from differential digestion by DpnI and DpnII. See Materials and Methods for details. (C) Composite analysis of 6mA distribution on the gene body of WT (blue) and ΔAMT1 cells (red). Genes are scaled to unit length and is extended to each side by unit length. Distribution frequency was calculated as ‘6mA amount at a certain position/total 6mA amount’. Solid lines: high methylation levels (80–100%); dashed lines: intermediate methylation levels (20–80%). Note that the remaining 6mA in ΔAMT1 cells was similarly accumulated downstream of transcription start sites (TSS), towards the 5′ end of the gene body. (D) Distribution profiles of 6mA, H2A.Z, H3K4me3 on the gene body of WT cells. Genes are scaled to unit length and is extended to each side by unit length. Note that all of them were accumulated downstream of TSS, towards the 5′ end of the gene body. (E) Correlation matrix of H2A.Z, H3K4me3, and 6mA frequency in 1 kb of the gene body downstream of TSS. Correlation coefficients and correlation color dots are shown. (F) GBrowse snapshot of the RAB46 locus (TTHERM_00209270). Tracks from top to bottom are: gene model, mRNA transcripts, 6mA (WT and ΔAMT1 cells), and RNA-seq coverage in WT, ΔAMT1 and AMT1-RS cells (two replicates, AMT1-RS-17 and AMT1-RS-14). Note that both 6mA and RAB46 expression were eliminated in ΔAMT1 cells. (G) Extraordinarily large contractile vacuoles (CV) were observed upon RAB46 knockdown (KD). Red arrowheads: large CV; red arrows: cells with large CV.
Figure 6.
Figure 6.
Attenuation of strong 6mA and nucleosome positioning relative to each other in ΔAMT1 cells. (A) Distribution profiles of 6mA (top panel) and nucleosome (bottom panel) around TSS in WT (blue) and ΔAMT1 cells (red). (B) Nucleosome positioning in WT (blue) and ΔAMT1 (red) cells. Degrees of positioning were calculated for +1, +2 and +3 nucleosomes in the gene body. See Materials and Methods for details. (C) 6mA distribution relative to the nucleosome dyad in WT (top panel) and ΔAMT1 cells (bottom panel). The violin plots show the density of 6mA between neighboring nucleosome dyads, grouped by methylation levels. The box plots within represent the median and the interquartile range of each group. Red dotted lines mark the trend for 6mA with high methylation levels to be enriched in linker DNA in WT (top panel) but not ΔAMT1 cells (bottom panel). (D) Dispersions of 6mA increase further downstream of TSS in ΔAMT1 cells (right panel) but not WT cells (left panel). The violin/box plots show 6mA distribution between neighboring nucleosomes, grouped by their positions in the gene body (+1/+2, +2/+3, +3/+4, +4/+5).
Figure 7.
Figure 7.
AMT1 represents a new class of DNA 6mA methyltransferases and epigenetic regulators in eukaryotes. (A) A diagram summarizing AMT1′s roles as an epigenetic regulator. (B) Phyletic distribution of MT-A70 family genes (AMT1, AMT6/7, and METTL4 clades) and features of DNA methylation (high 6mA, ApT methylation, Pol II TSS association, and CpG methylation). High 6mA is defined as 6mA/A ratio higher than 0.1%. Star, triangle and square denote presence of AMT1, AMT6/7, and METTTL4 homologues in corresponding species. Solid circle, cross in circle, hollow circle, and hemi-solid circle denote presence, absence, no available data (N/A), variability/uncertainty in corresponding features of DNA methylation. See Supplementary Table S10 for details.

References

    1. Gorovsky M.A., Hattman S., Pleger G.L.. [6N] Methyl adenine in the nuclear DNA of a eucaryote, Tetrahymena pyriformis. J. Cell Biol. 1973; 56:697–701. - PMC - PubMed
    1. Ammermann D., Steinbrück G., Baur R., Wohlert H.. Methylated bases in the DNA of the ciliate Stylonychia mytilus. Eur. J. Cell Biol. 1981; 24:154–156. - PubMed
    1. Cummings D.J., Tait A., Goddard J.M.. Methylated bases in DNA from Paramecium aurelia. Biochim. Biophys. Acta Nucleic Acids Protein Synth. 1974; 374:1–11. - PubMed
    1. Rae P.M., Steele R.E.. Modified bases in the DNAs of unicellular eukaryotes: an examination of distributions and possible roles, with emphasis on hydroxymethyluracil in dinoflagellates. Biosystems. 1978; 10:37–53. - PubMed
    1. Salvini M., Barone E., Ronca S., Nobili R.. DNA methylation in vegetative and conjugating cells of a protozoan ciliate: Blepharisma japonicum. Dev. Genet. 1986; 7:149–158.

Publication types

MeSH terms